Welcome to the ShapeRNA Help Page
Table of Contents
1. Overview of ShapeRNA
ShapeRNA is an integrated web server designed for RNA secondary structure prediction, structural ensemble analysis, and structure-aware functional annotation. The platform supports both sequence-based and chemical probing sequencing-guided modeling, enabling users to investigate RNA folding under thermodynamic and experimentally constrained conditions. The server integrates multiple RNA structure prediction algorithms, including thermodynamic models, deep learning–based predictors, and chemical probing sequencing-informed ensemble methods. In addition to structure prediction, ShapeRNA performs downstream regulatory annotation by mapping epitranscriptomic modifications (m⁶A), microRNA (miRNA) target regions, and RNA-binding protein (RBP) motifs onto predicted RNA structures and structural ensembles. Interactive visualizations are provided to facilitate interpretation of RNA structural heterogeneity and its potential regulatory implications.
By providing an integrated and ensemble-aware analytical environment that spans sequence-based and experimentally informed modeling, ShapeRNA enables systematic investigation of RNA structure–function relationships and supports integrative studies of RNA structural heterogeneity and post-transcriptional regulation.
2. Understanding the Functional Design of ShapeRNA
RNA secondary structure is inherently dynamic rather than static. Although many computational approaches have been developed to predict RNA secondary structures, most traditional methods focus on identifying a single representative structure—typically the minimum free energy (MFE) conformation or another high-probability structure under equilibrium assumptions. While such representative structures have been widely used and remain informative, they provide only a partial view of RNA folding behavior. In vivo, many RNA molecules do not adopt a single dominant conformation but instead exist as dynamic ensembles of alternative structures, particularly in mRNAs and long non-coding RNAs where conformational flexibility plays a critical regulatory role.
To address this conceptual shift from single-structure prediction to ensemble-level modeling, ShapeRNA is designed to support RNA secondary structure analysis across multiple levels of structural resolution. At the sequence-only level, ShapeRNA enables both single-structure prediction and ensemble-oriented analysis, allowing users to obtain representative folds or to explore alternative conformations that may coexist under physiological conditions. When experimental probing data are available, reactivity information can be incorporated to support and refine single optimal structure prediction, while also enabling ensemble-level characterization of RNA conformational landscapes. ShapeRNA further supports direct processing of sequencing-derived probing data, allowing inference of ensemble composition from experimental readouts without extensive manual preprocessing.
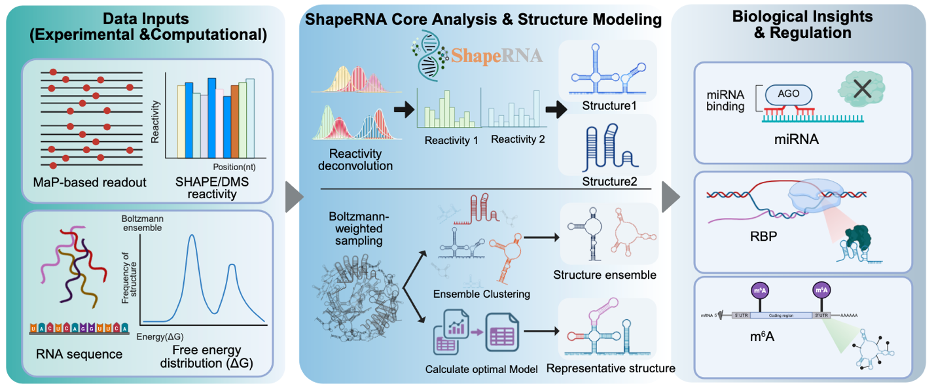
Beyond structural inference, RNA secondary structures are tightly linked to post-transcriptional regulatory mechanisms. Structural features influence the accessibility of splice sites, microRNA target regions, and RNA-binding protein (RBP) recognition motifs, while chemical modifications such as N6-methyladenosine (m⁶A) can induce local structural rearrangements that alter RNA–protein and RNA–RNA interactions. To facilitate investigation of these structure–regulation relationships, ShapeRNA integrates structure-aware regulatory annotation as a core component of its functional design. Predicted structures and ensembles can be analyzed in conjunction with regulatory features, enabling users to examine how structural context may modulate regulatory element accessibility and function.
The functional design of ShapeRNA therefore reflects a unified analytical perspective: RNA structure prediction is treated not as an isolated endpoint, but as a foundation for integrative analysis of structural dynamics and regulatory mechanisms. By supporting analysis workflows that span from single representative structures to experimentally informed structural ensembles, and by linking these structures to regulatory annotations and visualization modules, ShapeRNA enables users to explore RNA structure–function relationships from multiple complementary angles. This design allows researchers to move beyond static structural models and identify structural features, conformational shifts, or regulatory contexts that may underlie biological function or suggest new hypotheses for experimental investigation.
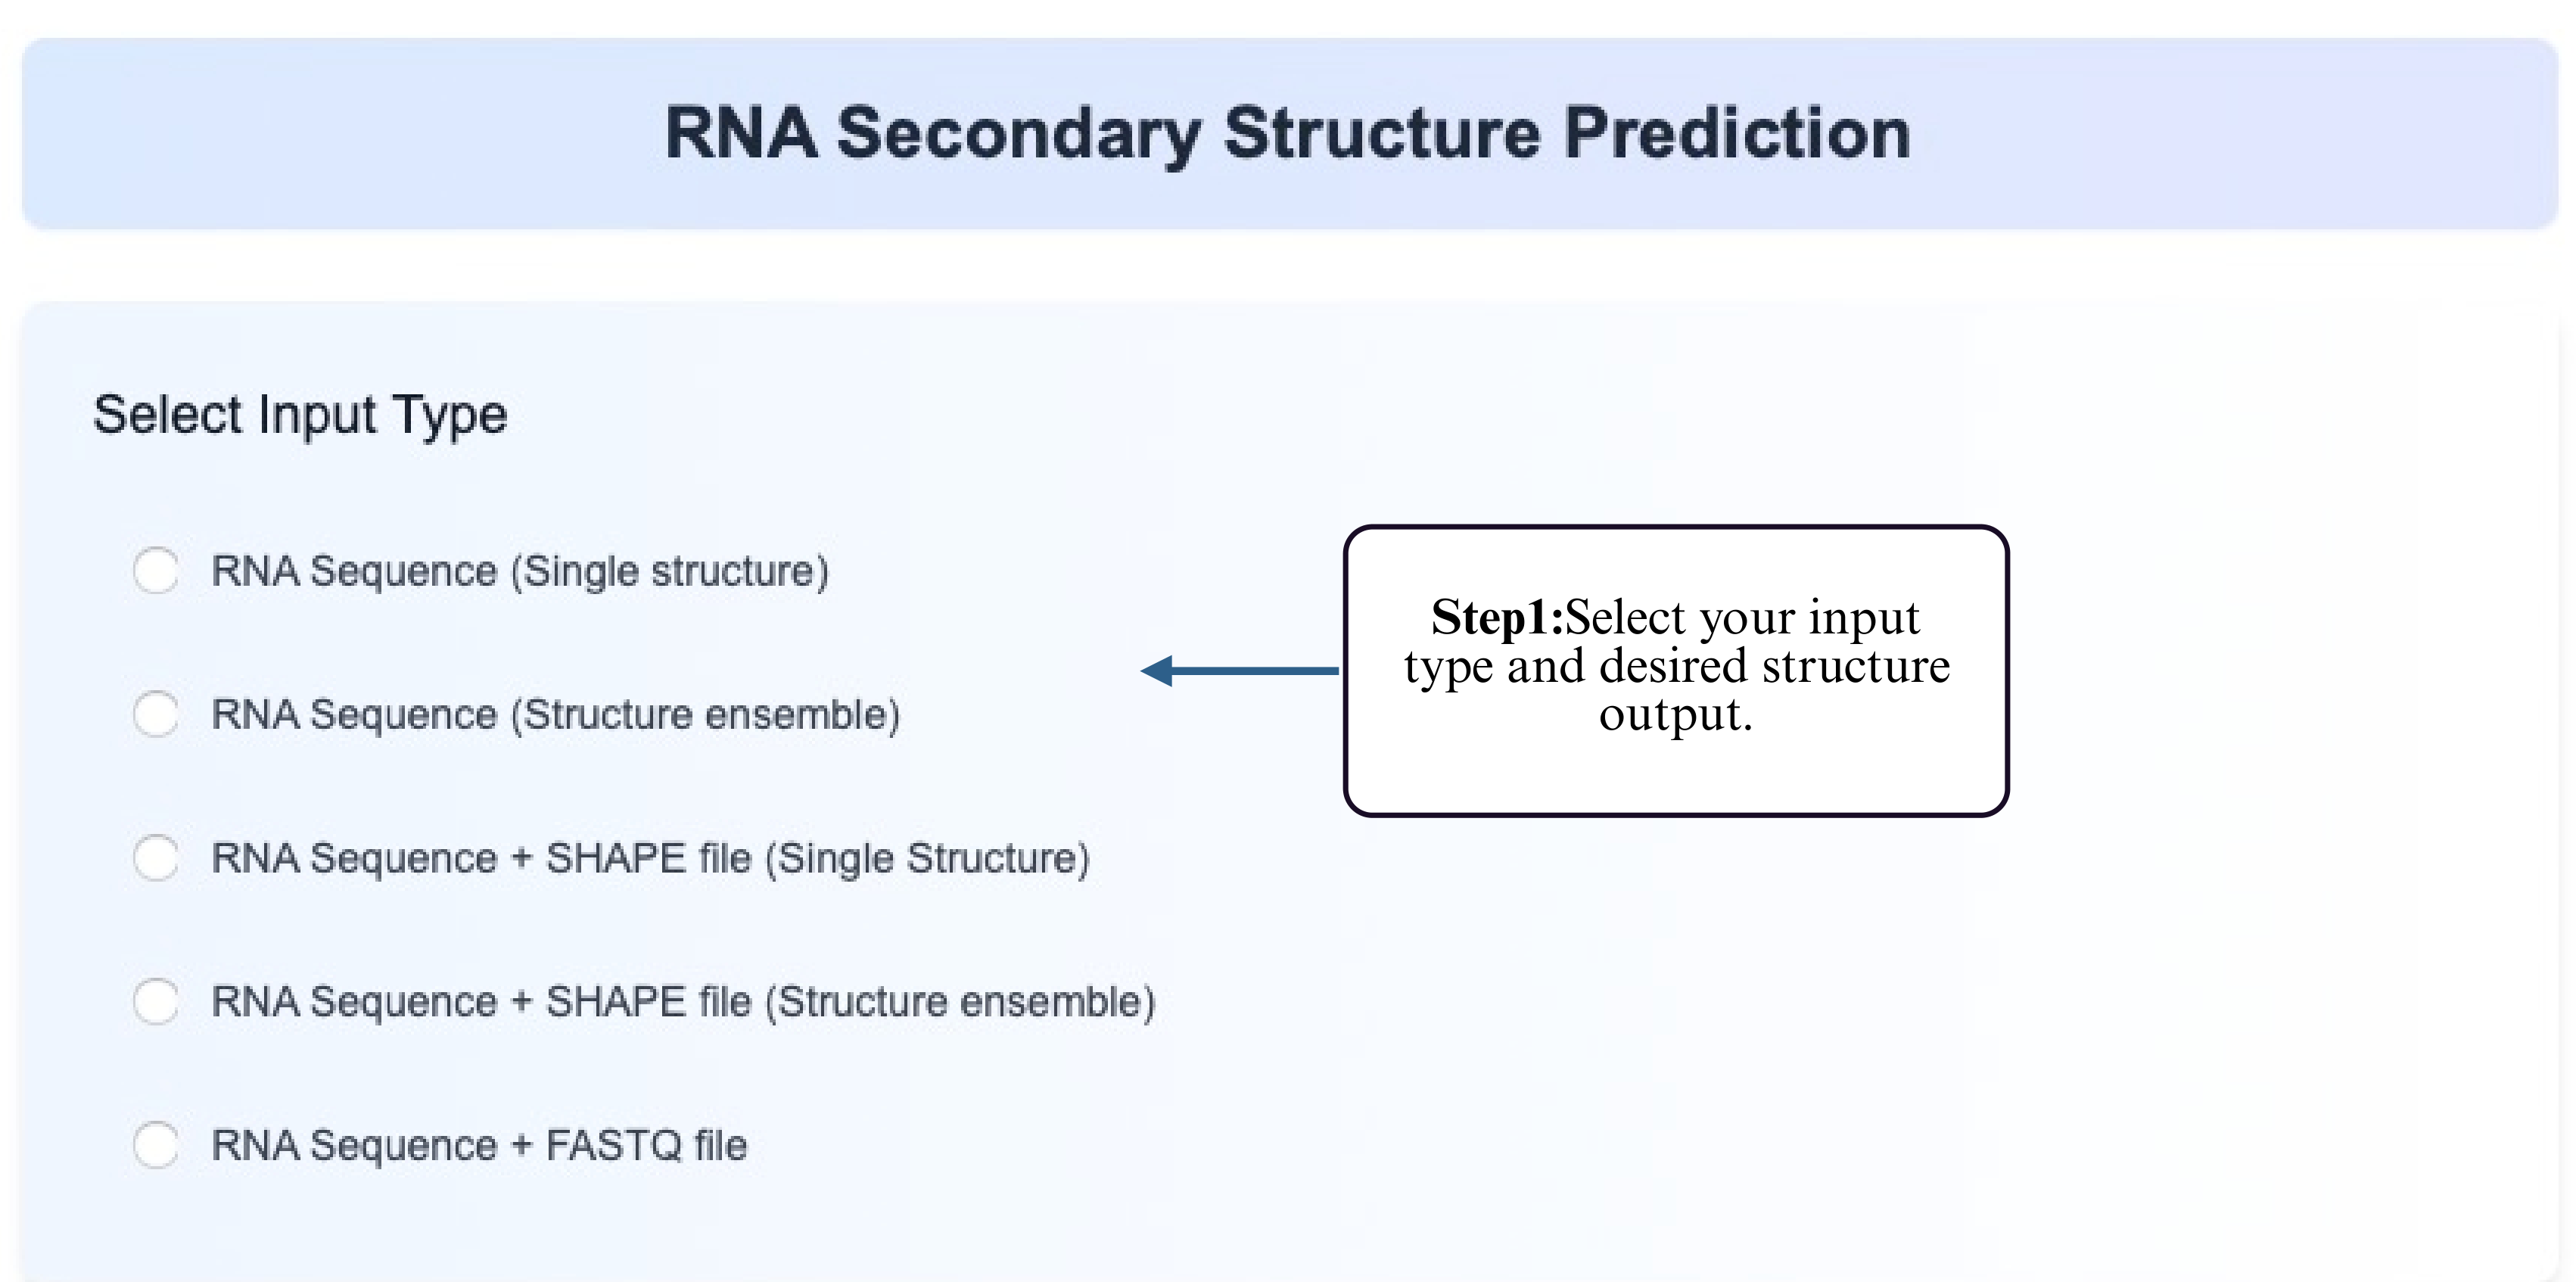
3. Input Formats and Analysis Configuration
3.1 Fasta file
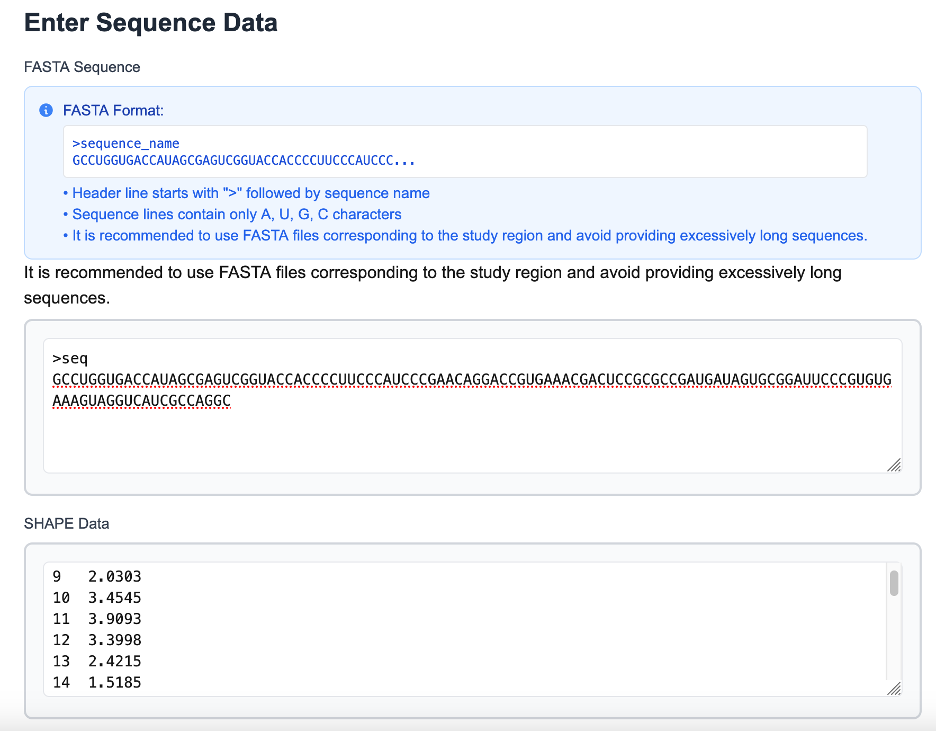
ShapeRNA accepts RNA sequences provided in standard FASTA format as the primary input for sequence-based analysis. The input sequence should include a header line beginning with the ">" symbol followed by a sequence identifier, and one or more lines containing RNA nucleotides (A, U, G, and C only). FASTA input enables both representative secondary structure prediction and ensemble-level structural analysis when no experimental probing data are available.
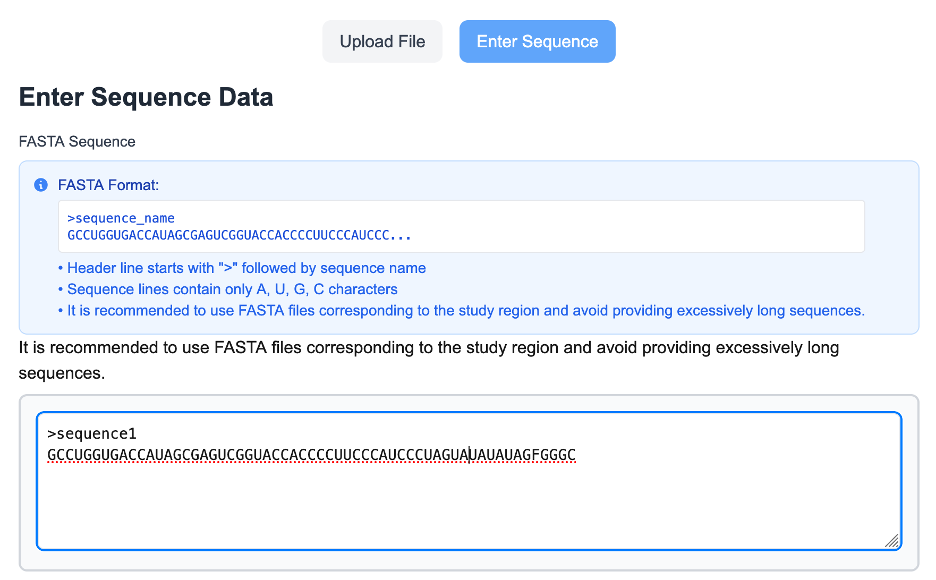
To facilitate correct formatting, the interface displays an example FASTA template and validates sequence content in real time. Users are encouraged to provide sequences corresponding to the specific region of interest rather than excessively long transcripts, as this improves interpretability and computational efficiency.
3.2 Reactivity file
In addition to sequence-only input, ShapeRNA supports RNA secondary structure modeling guided by SHAPE/DMS reactivity data. SHAPE input consists of a two-column, position-resolved reactivity profile, where each line specifies a nucleotide position and its corresponding SHAPE/DMS reactivity value. The length of the SHAPE/DMS reactivity profile must match the length of the input RNA sequence to ensure correct positional alignment.
SHAPE/DMS reactivity values reflect the local structural flexibility of RNA nucleotides, with higher values generally indicating unpaired or structurally dynamic regions, and lower values corresponding to constrained or base-paired positions. By incorporating these experimentally derived reactivity profiles, ShapeRNA enables structure prediction to be informed by nucleotide-resolution measurements of RNA conformational behavior rather than sequence information alone.
Reactivity-guided modeling in ShapeRNA can be applied in two complementary ways. First, reactivity constraints can be used to support and refine representative secondary structure prediction by biasing folding models toward conformations consistent with experimental data. Second, reactivity profiles can be used to enable ensemble-level analysis, allowing exploration of alternative RNA conformations and structural heterogeneity that better reflect experimentally observed folding landscapes.
Reactivity input files are expected to contain nucleotide positions and their corresponding reactivity values, typically derived from standard analysis pipelines appropriate to the probing assay (e.g., ShapeMapper2, Spats, or icSHAPE-pipe), where reactivity values are calculated, background-corrected, and normalized to ensure comparability across datasets. Positions without available reactivity values must be represented as “NA”; in this context, 0 denotes low reactivity (valid signal), whereas NA indicates missing data (no measurement). Incorrectly assigning missing positions as 0 may introduce bias into structure prediction and ensemble inference.
3.3 Fastq file
ShapeRNA additionally supports direct input of sequencing-derived probing data in FASTQ format for ensemble-level RNA structure inference. FASTQ input typically corresponds to reads generated from chemical probing experiments, such as SHAPE- or DMS-based assays, in which nucleotide modifications introduced by structure-sensitive reagents are captured as mutations during reverse transcription and sequencing.
The FASTQ files contain raw sequencing reads along with base quality information and may include paired end reads depending on the experimental design. These reads reflect the structural state of RNA molecules under specific conditions. ShapeRNA processes these sequencing-derived signals directly, without requiring users to manually convert reads into reactivity profiles or intermediate formats.
By analyzing mutation patterns and their co-occurrence across individual reads, ShapeRNA enables inference of RNA structural heterogeneity and estimation of ensemble composition from sequencing data. This approach allows users to investigate alternative RNA conformations and condition-dependent structural shifts, providing a data-driven view of RNA conformational landscapes that complements sequence-based and reactivity-guided modeling.
3.4 Dot-Bracket Structure Input and Result Format
In addition to raw sequence input, ShapeRNA supports RNA secondary structure input represented in dot–bracket notation, a widely used standard format for encoding RNA secondary structures. This format allows users to provide pre-defined or externally generated RNA structural models directly to the server.
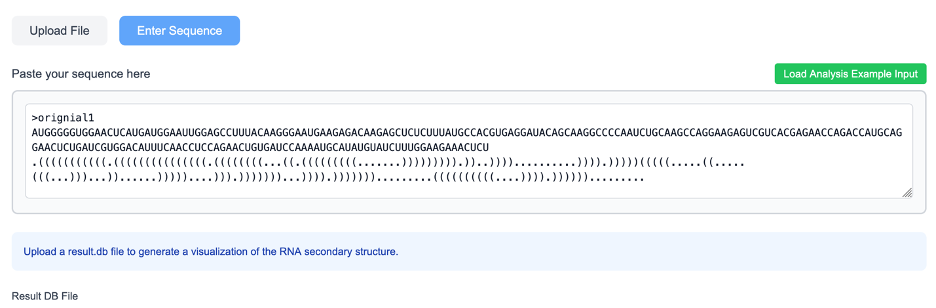
A dot–bracket input consists of two components. The first line specifies the RNA sequence in FASTA format, while the following line encodes the corresponding secondary structure using dot–bracket symbols. In this representation, paired nucleotides are denoted by matching parentheses “(” and “)”, indicating base-pair interactions, whereas unpaired nucleotides are represented by dots “.”. Each character in the structure line corresponds positionally to a nucleotide in the sequence, ensuring a one-to-one mapping between sequence and structural state.
The dot–bracket format accepted by ShapeRNA follows the conventional syntax used by most RNA secondary structure prediction tools. Users may provide dot–bracket structures generated by external software or obtained from previous analyses, allowing ShapeRNA to serve as a flexible platform for structure-centered RNA analysis without requiring re-computation of secondary structures. This input option is particularly useful when users wish to analyze or interpret specific structural models derived from prior studies or alternative prediction pipelines.
4. Output Formats and Result Interpretation
ShapeRNA presents analysis results through an integrated output interface that combines RNA structure visualization and tabular summaries of structure-associated regulatory features. The output is designed to allow users to directly inspect predicted RNA secondary structures and interpret associated regulatory annotations in a consistent and intuitive manner.
4.1 Core structural output of ShapeRNA
The primary structural output generated by ShapeRNA is a set of RNA secondary structures represented in dot-bracket notation. Each output entry consists of the RNA sequence followed by its corresponding dot-bracket string, where paired nucleotides are denoted by matching parentheses and unpaired nucleotides by dots. For ensemble-level analysis, multiple alternative structures are reported sequentially for the same sequence, reflecting coexisting conformations inferred from the data.
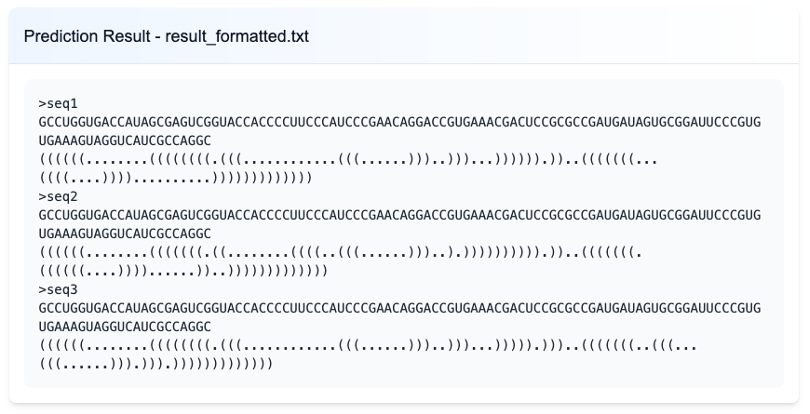
These dot-bracket structures serve as the central intermediate representation within ShapeRNA. All downstream analyses and visualizations, including interactive secondary structure rendering, arc diagram–based structure comparison, and the integration of regulatory features such as miRNA binding sites, m⁶A modification sites, and RNA-binding protein (RBP) motifs, are derived directly from this structural output. By using a unified dot-bracket–based representation, ShapeRNA ensures consistency across different analysis modules while allowing diverse structural perspectives to be explored.
4.2 RNA Secondary Structure Visualization
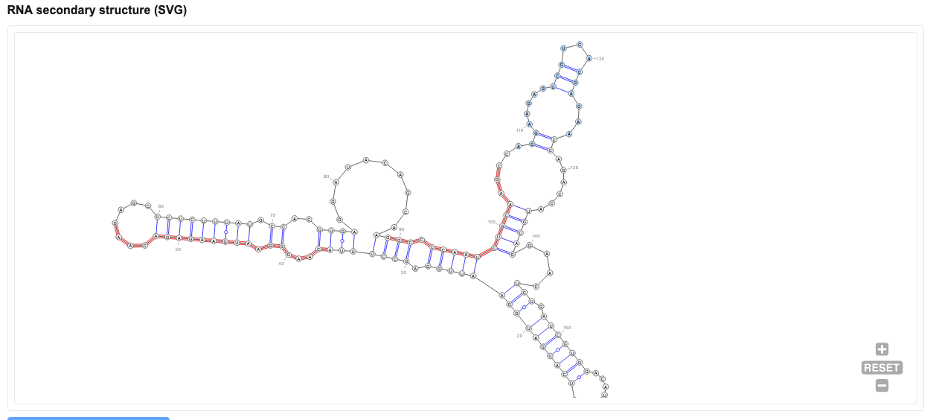
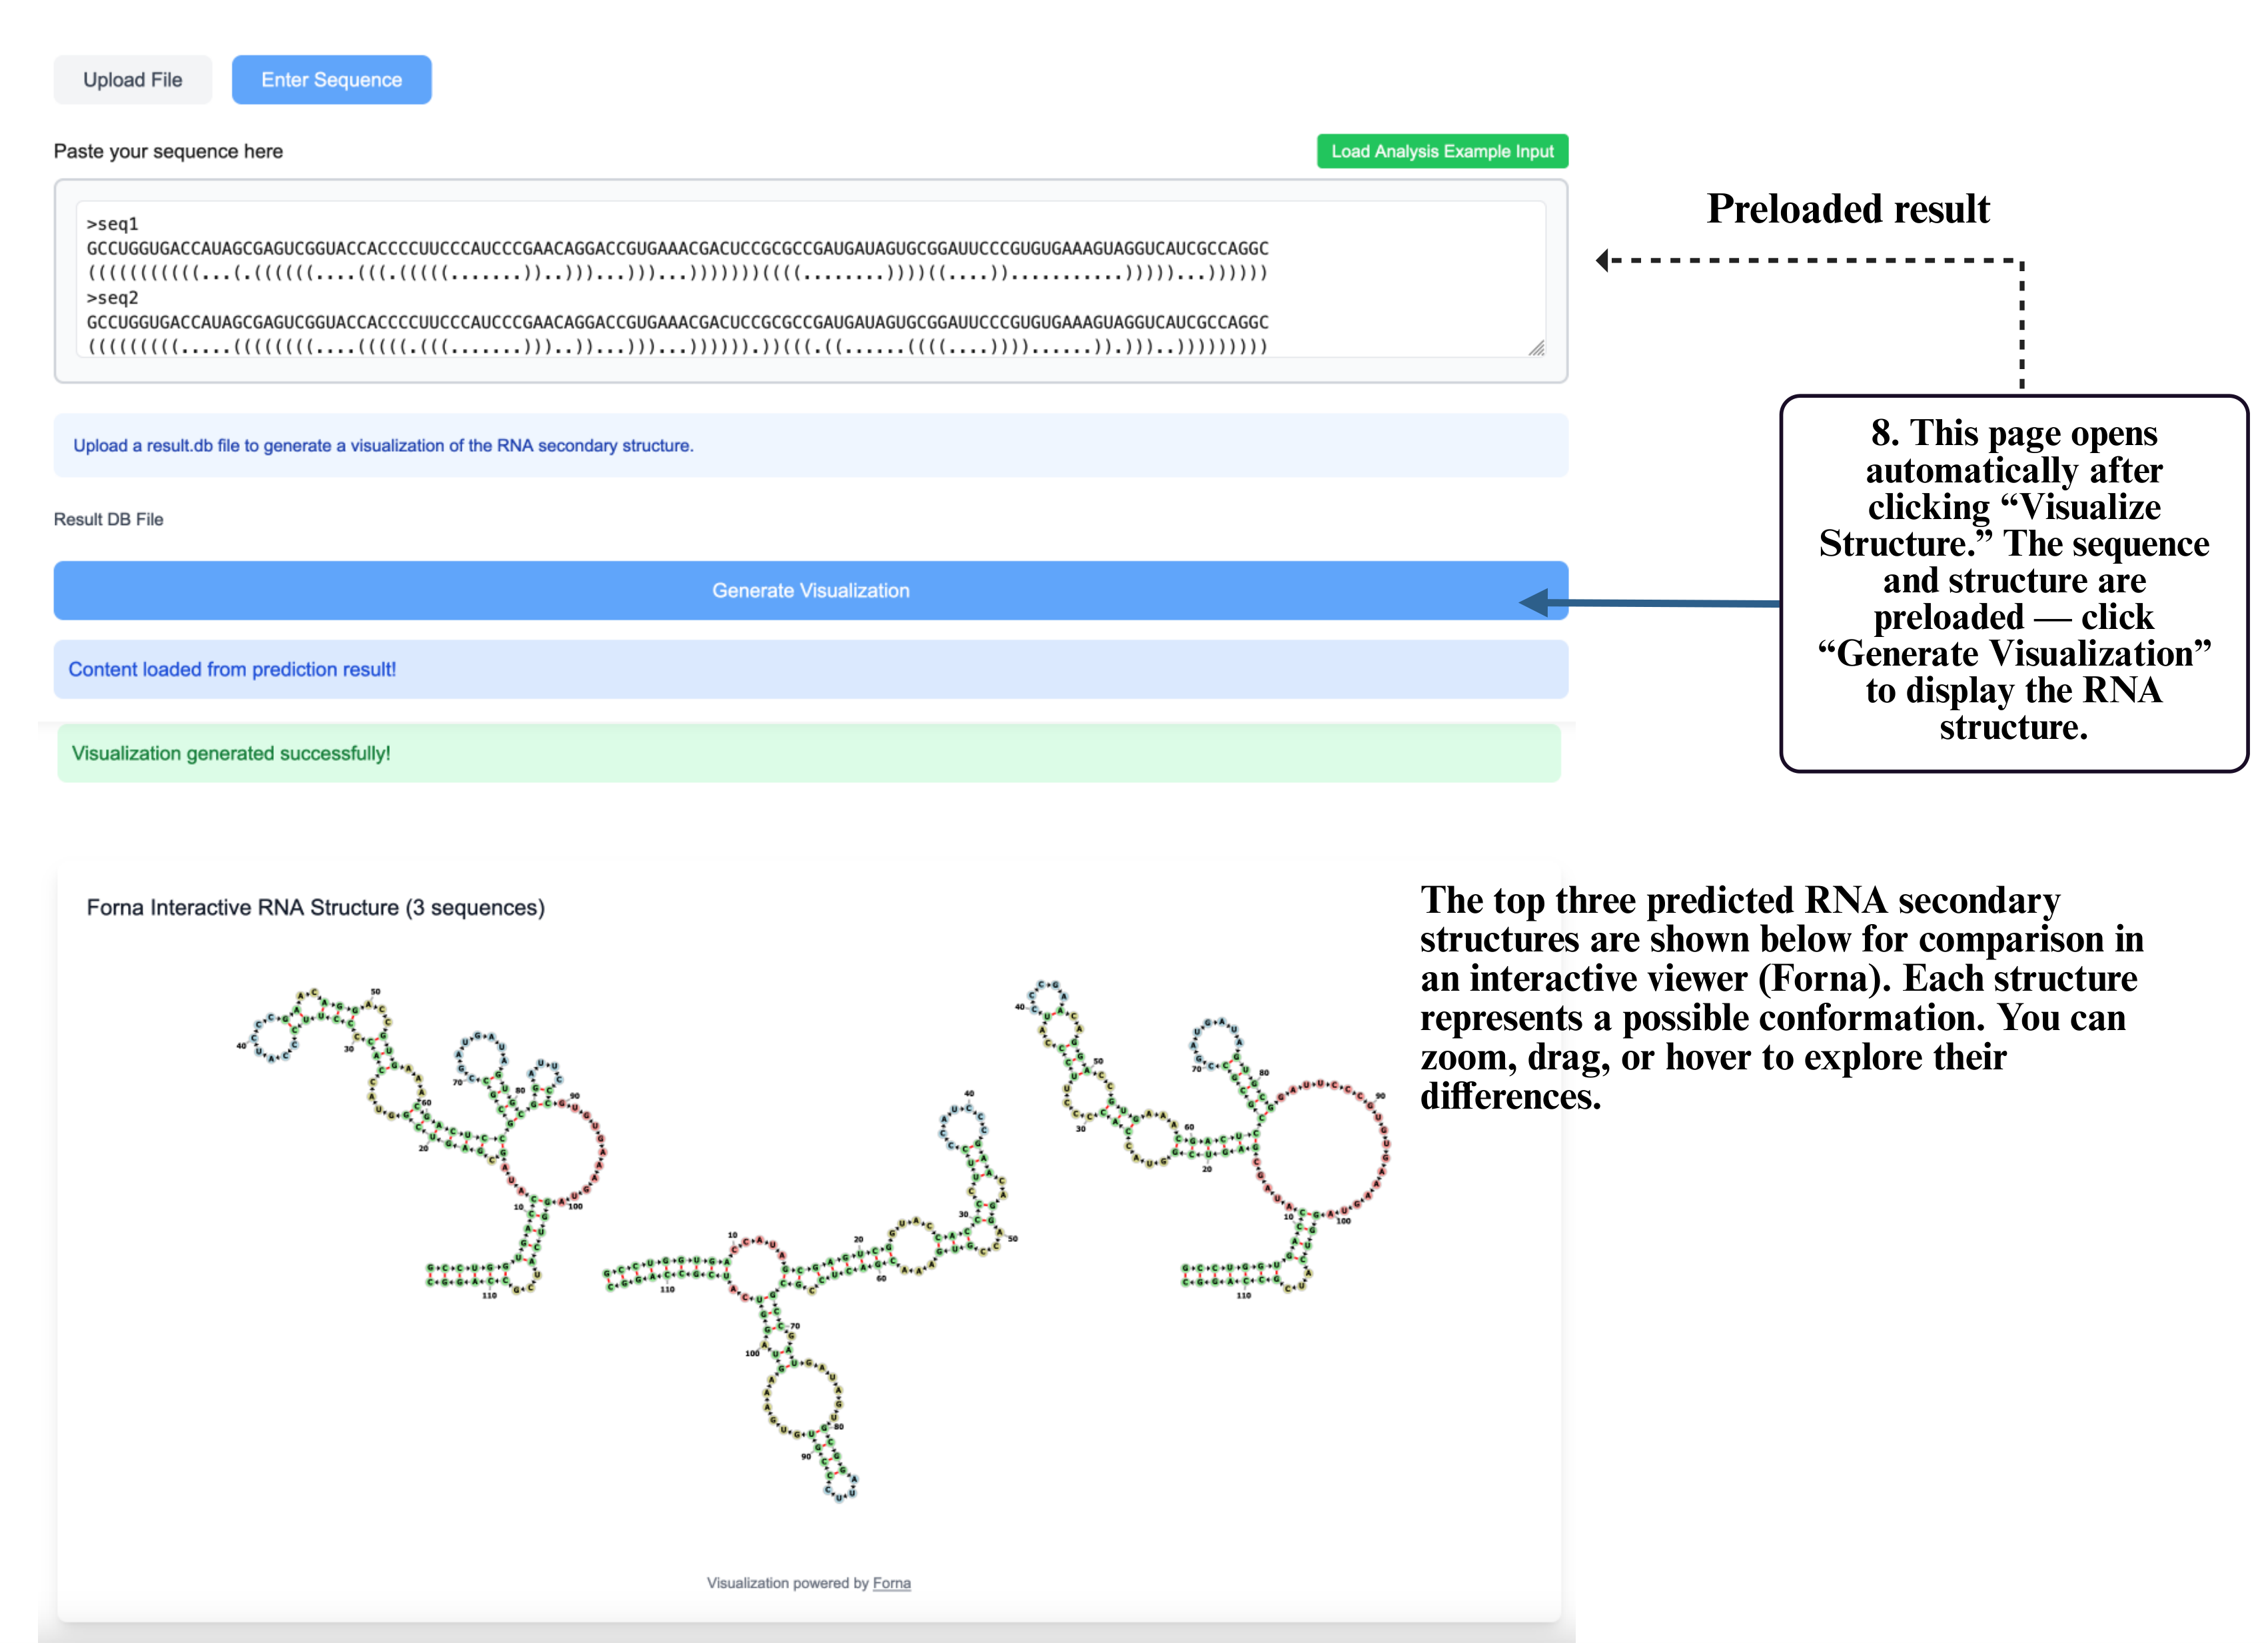
Predicted RNA secondary structures are rendered using an interactive visualization interface powered by the Forna engine. The structure is displayed in a two-dimensional layout where base-pairing interactions, loops, and junctions are explicitly shown. Individual nucleotides are labeled and color-coded, and users may interactively drag nodes to adjust the layout for clearer inspection of local or long-range structural features. This interactive view enables convenient exploration of overall folding patterns, helix organization, and flexible regions without requiring external visualization tools.
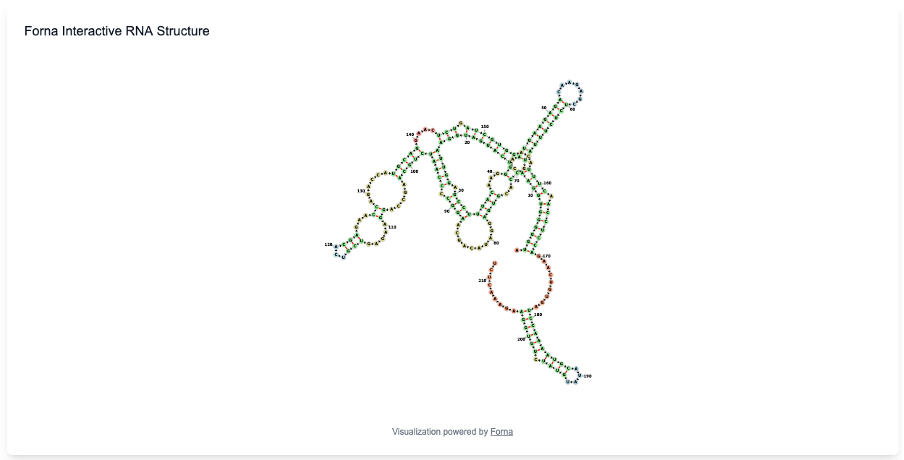
The displayed structure corresponds directly to the predicted dot–bracket output, ensuring consistency between textual and graphical representations.
4.3 Regulatory Annotation Tables
In addition to structural visualization, ShapeRNA reports predicted regulatory features in tabular format, allowing users to examine detailed annotation results alongside the RNA structure. Regulatory annotation results are summarized in structured tables, providing complementary sequence-, structure-, and confidence-level information for each predicted regulatory feature.
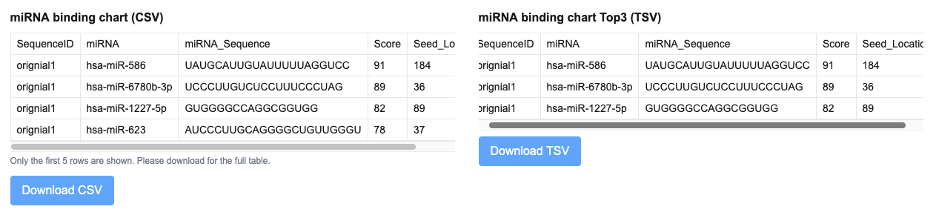
miRNA binding prediction results are summarized in tables listing the input sequence identifier, predicted miRNA name, miRNA sequence, binding score, and seed location. The binding score reflects the relative confidence of the predicted miRNA–RNA interaction, with higher values indicating stronger predicted binding potential. The seed location denotes the approximate nucleotide position on the RNA where the miRNA seed region is predicted to bind, providing positional context for structural interpretation.
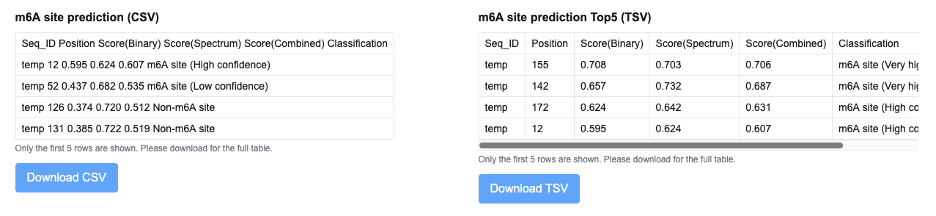
m⁶A site prediction results are reported with multiple confidence metrics for each candidate modification site. The output includes the sequence identifier, nucleotide position, a binary score reflecting classification confidence, a spectrum-based score capturing local sequence and contextual features, and a combined score integrating multiple prediction components. Based on these scores, each site is assigned a classification label (e.g., high confidence or very high confidence m⁶A site), enabling users to prioritize candidate modification sites for further analysis.
RNA-binding protein (RBP) binding results are provided as motif-level annotations, reporting the predicted protein name, motif identifier, matched k-mer sequence, Z-score, and associated P-value. The Z-score indicates the strength of motif enrichment relative to background expectation, while the P-value reflects the statistical significance of the predicted interaction. These results allow users to assess potential RBP-binding regions and their relevance in the context of RNA secondary structure.
4.4 RNA secondary structure visualization and color-coded regulatory annotations
ShapeRNA provides RNA secondary structure visualizations in scalable vector graphics (SVG) format to enable high-quality rendering and downstream figure editing. As a vector-based output, the SVG format allows arbitrary zooming and customization without loss of resolution, making it suitable for publication and presentation purposes.
In the SVG visualization, regulatory features are overlaid onto the predicted RNA secondary structure using a unified color-annotation scheme to facilitate intuitive interpretation. Regions predicted to be bound by RNA-binding proteins (RBPs) are highlighted with intensified blue coloring along the corresponding structural segments. Predicted miRNA-binding regions are indicated in red, marking structural elements potentially involved in post-transcriptional regulation. Candidate N6-methyladenosine (m⁶A) modification sites are denoted by orange markers at the corresponding nucleotide positions.
By integrating structural and regulatory annotations into a single visualization, this output enables users to directly assess the spatial relationships between RNA secondary structure and multiple layers of post-transcriptional regulation.
4.5 Arc diagram–based double-helix structure visualization
In addition to conventional secondary structure layouts, ShapeRNA provides an arc diagram–based representation of RNA secondary structure in PNG format, referred to here as the double helix structure view. This visualization offers an alternative, linearized perspective for comparing structural features along the RNA sequence. Unlike two-dimensional secondary structure layouts, arc diagrams provide a linearized representation that facilitates direct comparison of pairing patterns along the sequence.
In the arc diagram, the RNA sequence is arranged along a horizontal axis, with base-pairing interactions represented as arcs connecting paired nucleotide positions. Nested and long-range interactions appear as larger arcs, whereas local helices form shorter arcs. This representation emphasizes the distribution and span of base-pairing interactions across the entire transcript, making it particularly suitable for comparative structural analysis.
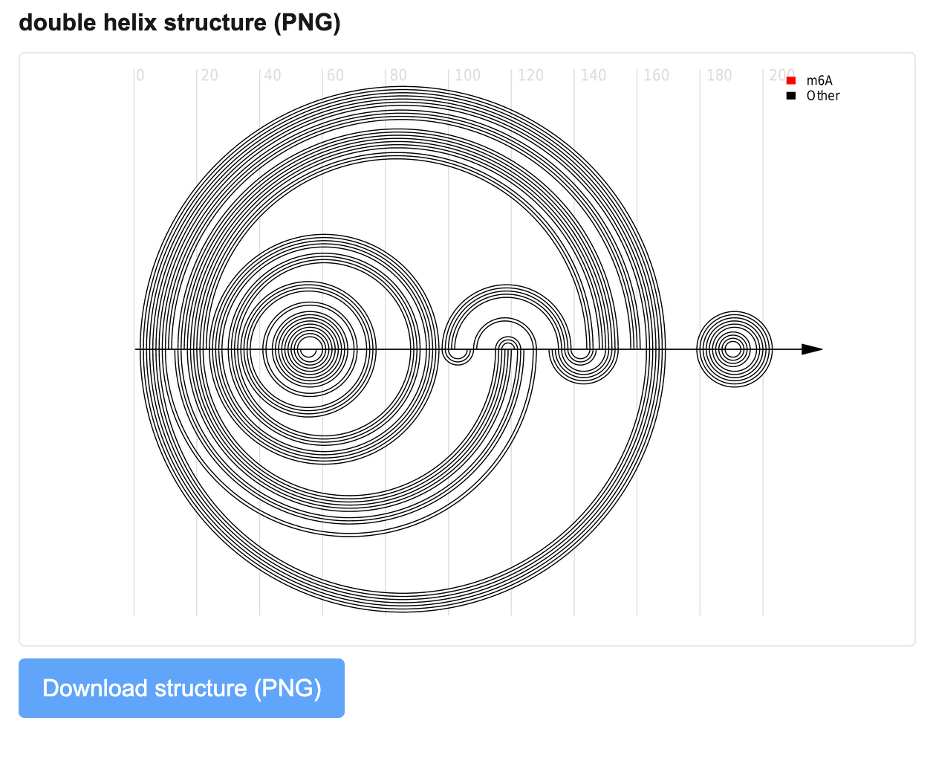
This arc-based visualization is used in the structure comparison and m⁶A-related analysis modules. In the context of m⁶A analysis, arc diagrams are generated for structures predicted with and without m⁶A modification signals, allowing users to visually compare how the presence of m⁶A may alter local or global RNA folding patterns. Differences in arc density, arc length, or pairing rearrangements reflect structural changes associated with m⁶A modification.
By providing a linear and comparison-oriented view, the arc diagram complements conventional secondary structure plots and offers a new angle for identifying structural differences that may be difficult to discern in two-dimensional layouts.
All structural and annotation results generated by ShapeRNA can be downloaded in standard text or graphical formats, enabling downstream analysis and reproducible use outside the web interface.
5. Tutorial
This guide will walk you through how to use the ShapeRNA web server for RNA secondary structure prediction and analysis. ShapeRNA provides multiple modes of operation tailored to different input types and analysis goals, including single structure prediction, SHAPE-guided modeling, and structure-based clustering from high-throughput sequencing data.
This tutorial section provides step-by-step guides for using ShapeRNA's various features and analysis modes. Follow the instructions below to learn how to perform different types of RNA structure predictions and analyses.

To begin, please select a module from the top navigation bar or the colored buttons on the homepage. You will then be guided through a step-by-step process—starting with choosing your input format and desired output type.
Single Structure Prediction
This tool allows you to predict a single RNA secondary structure from a plain RNA sequence. It is suitable when no additional experimental data (e.g., SHAPE reactivity) is available and you want to explore a most likely folding based on thermodynamic or learning-based models.
Step 1: Choose the Single Structure Prediction option from the Tool module.
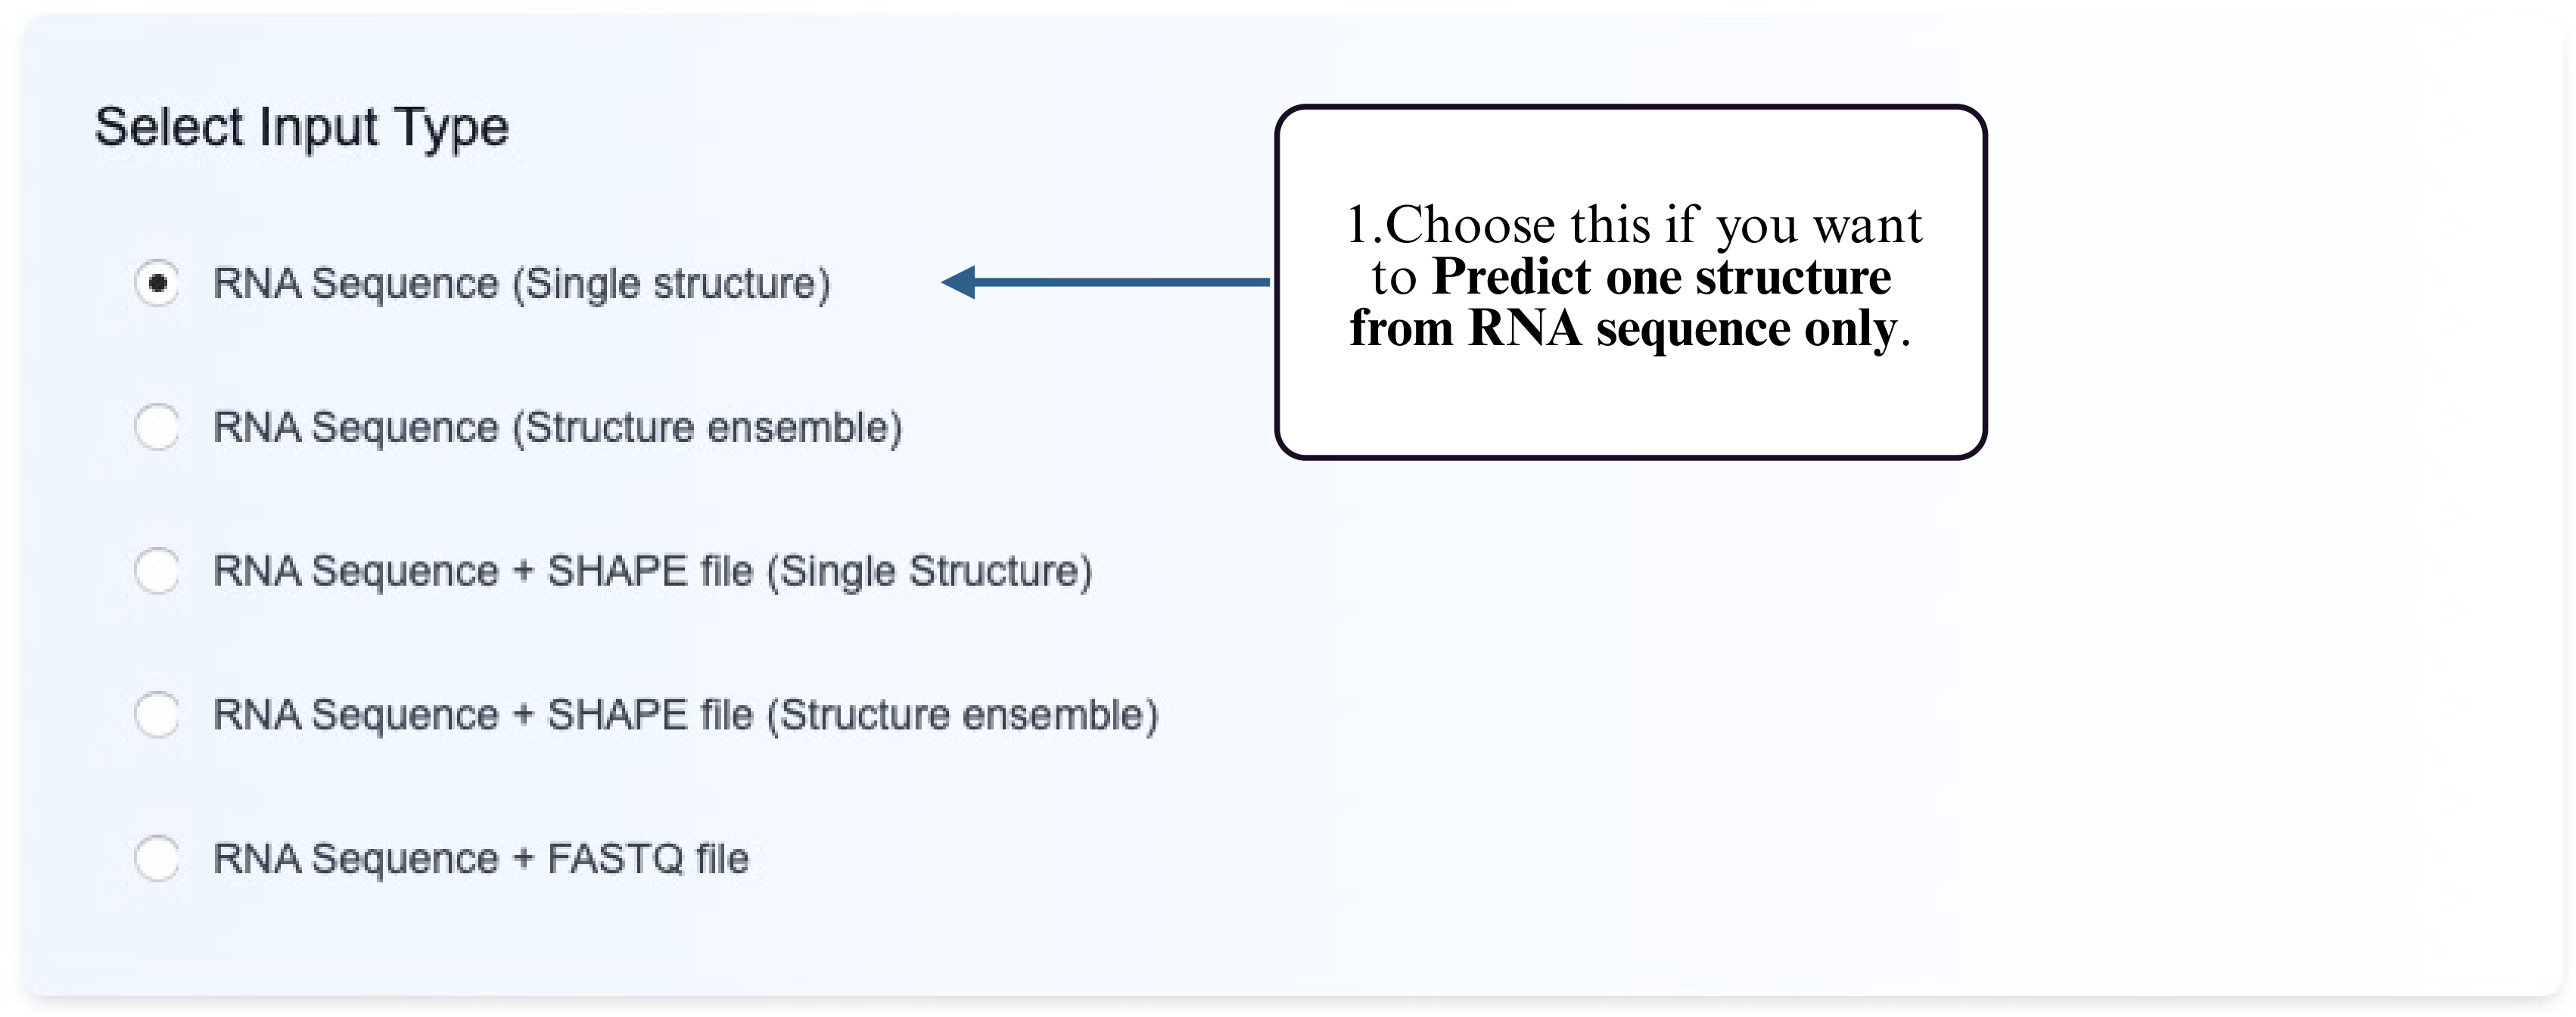
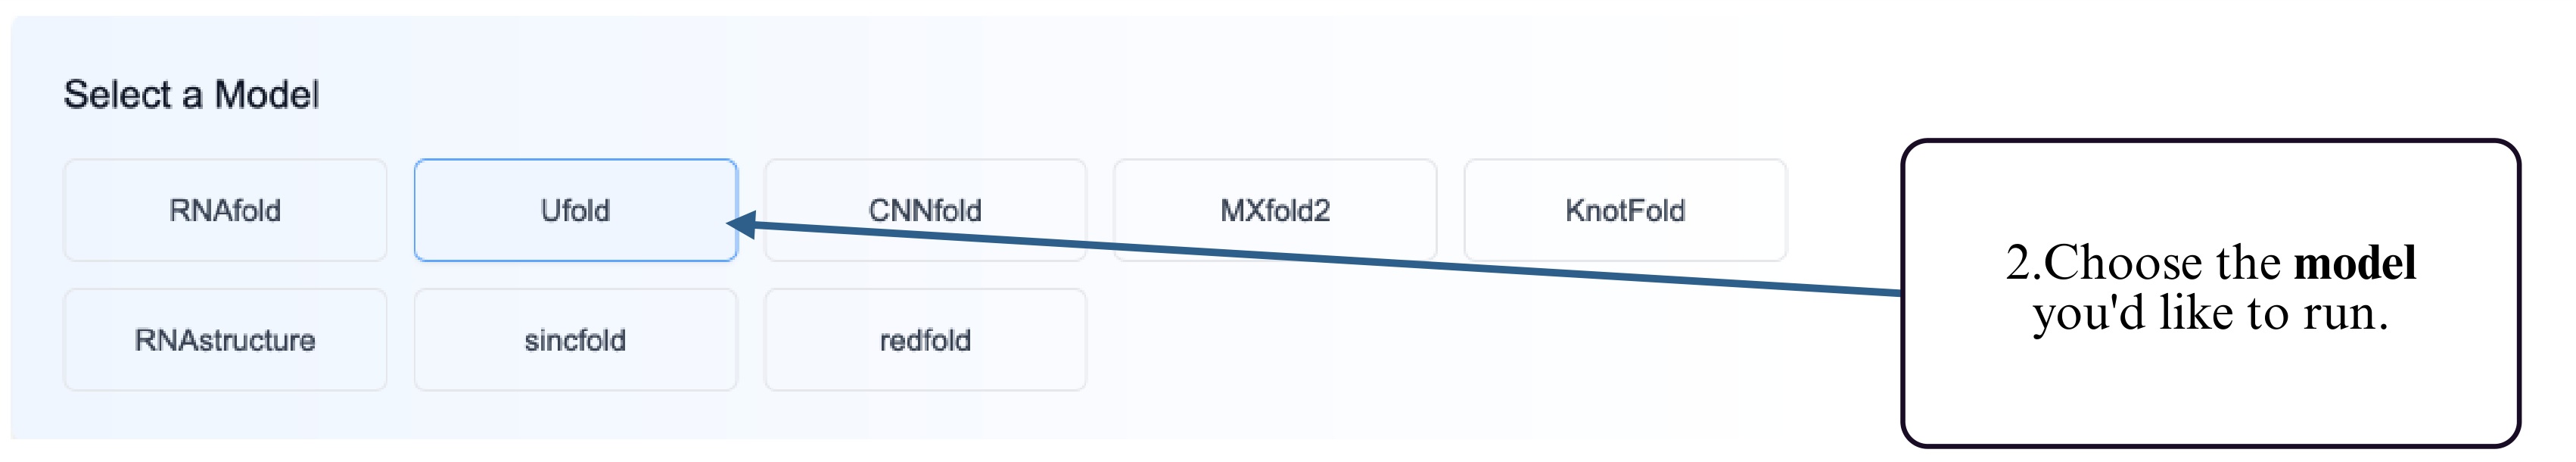
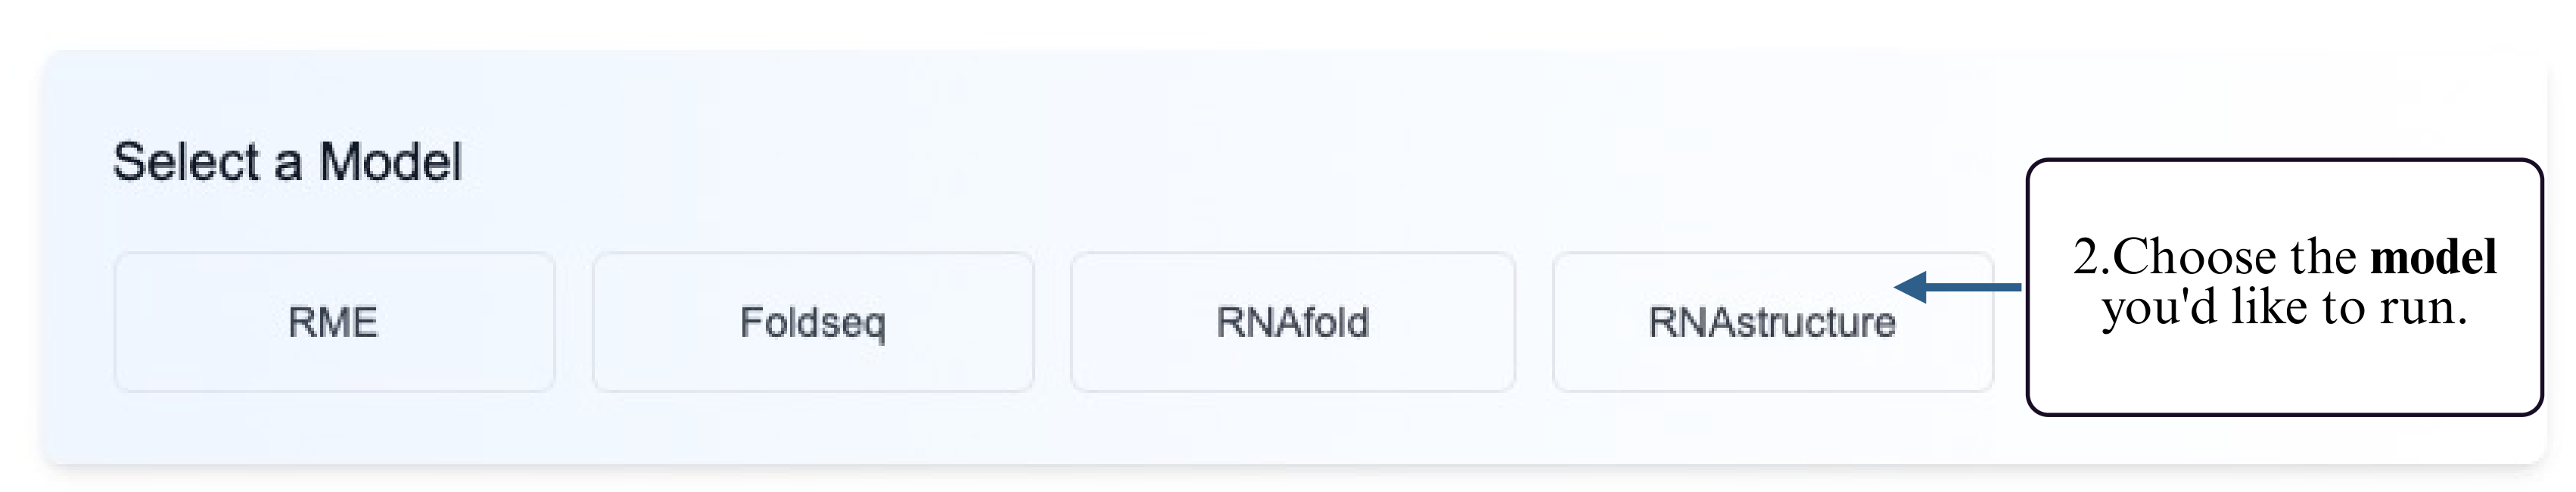
Step 2: Select the prediction model you wish to use (e.g., thermodynamic, deep learning, etc.).
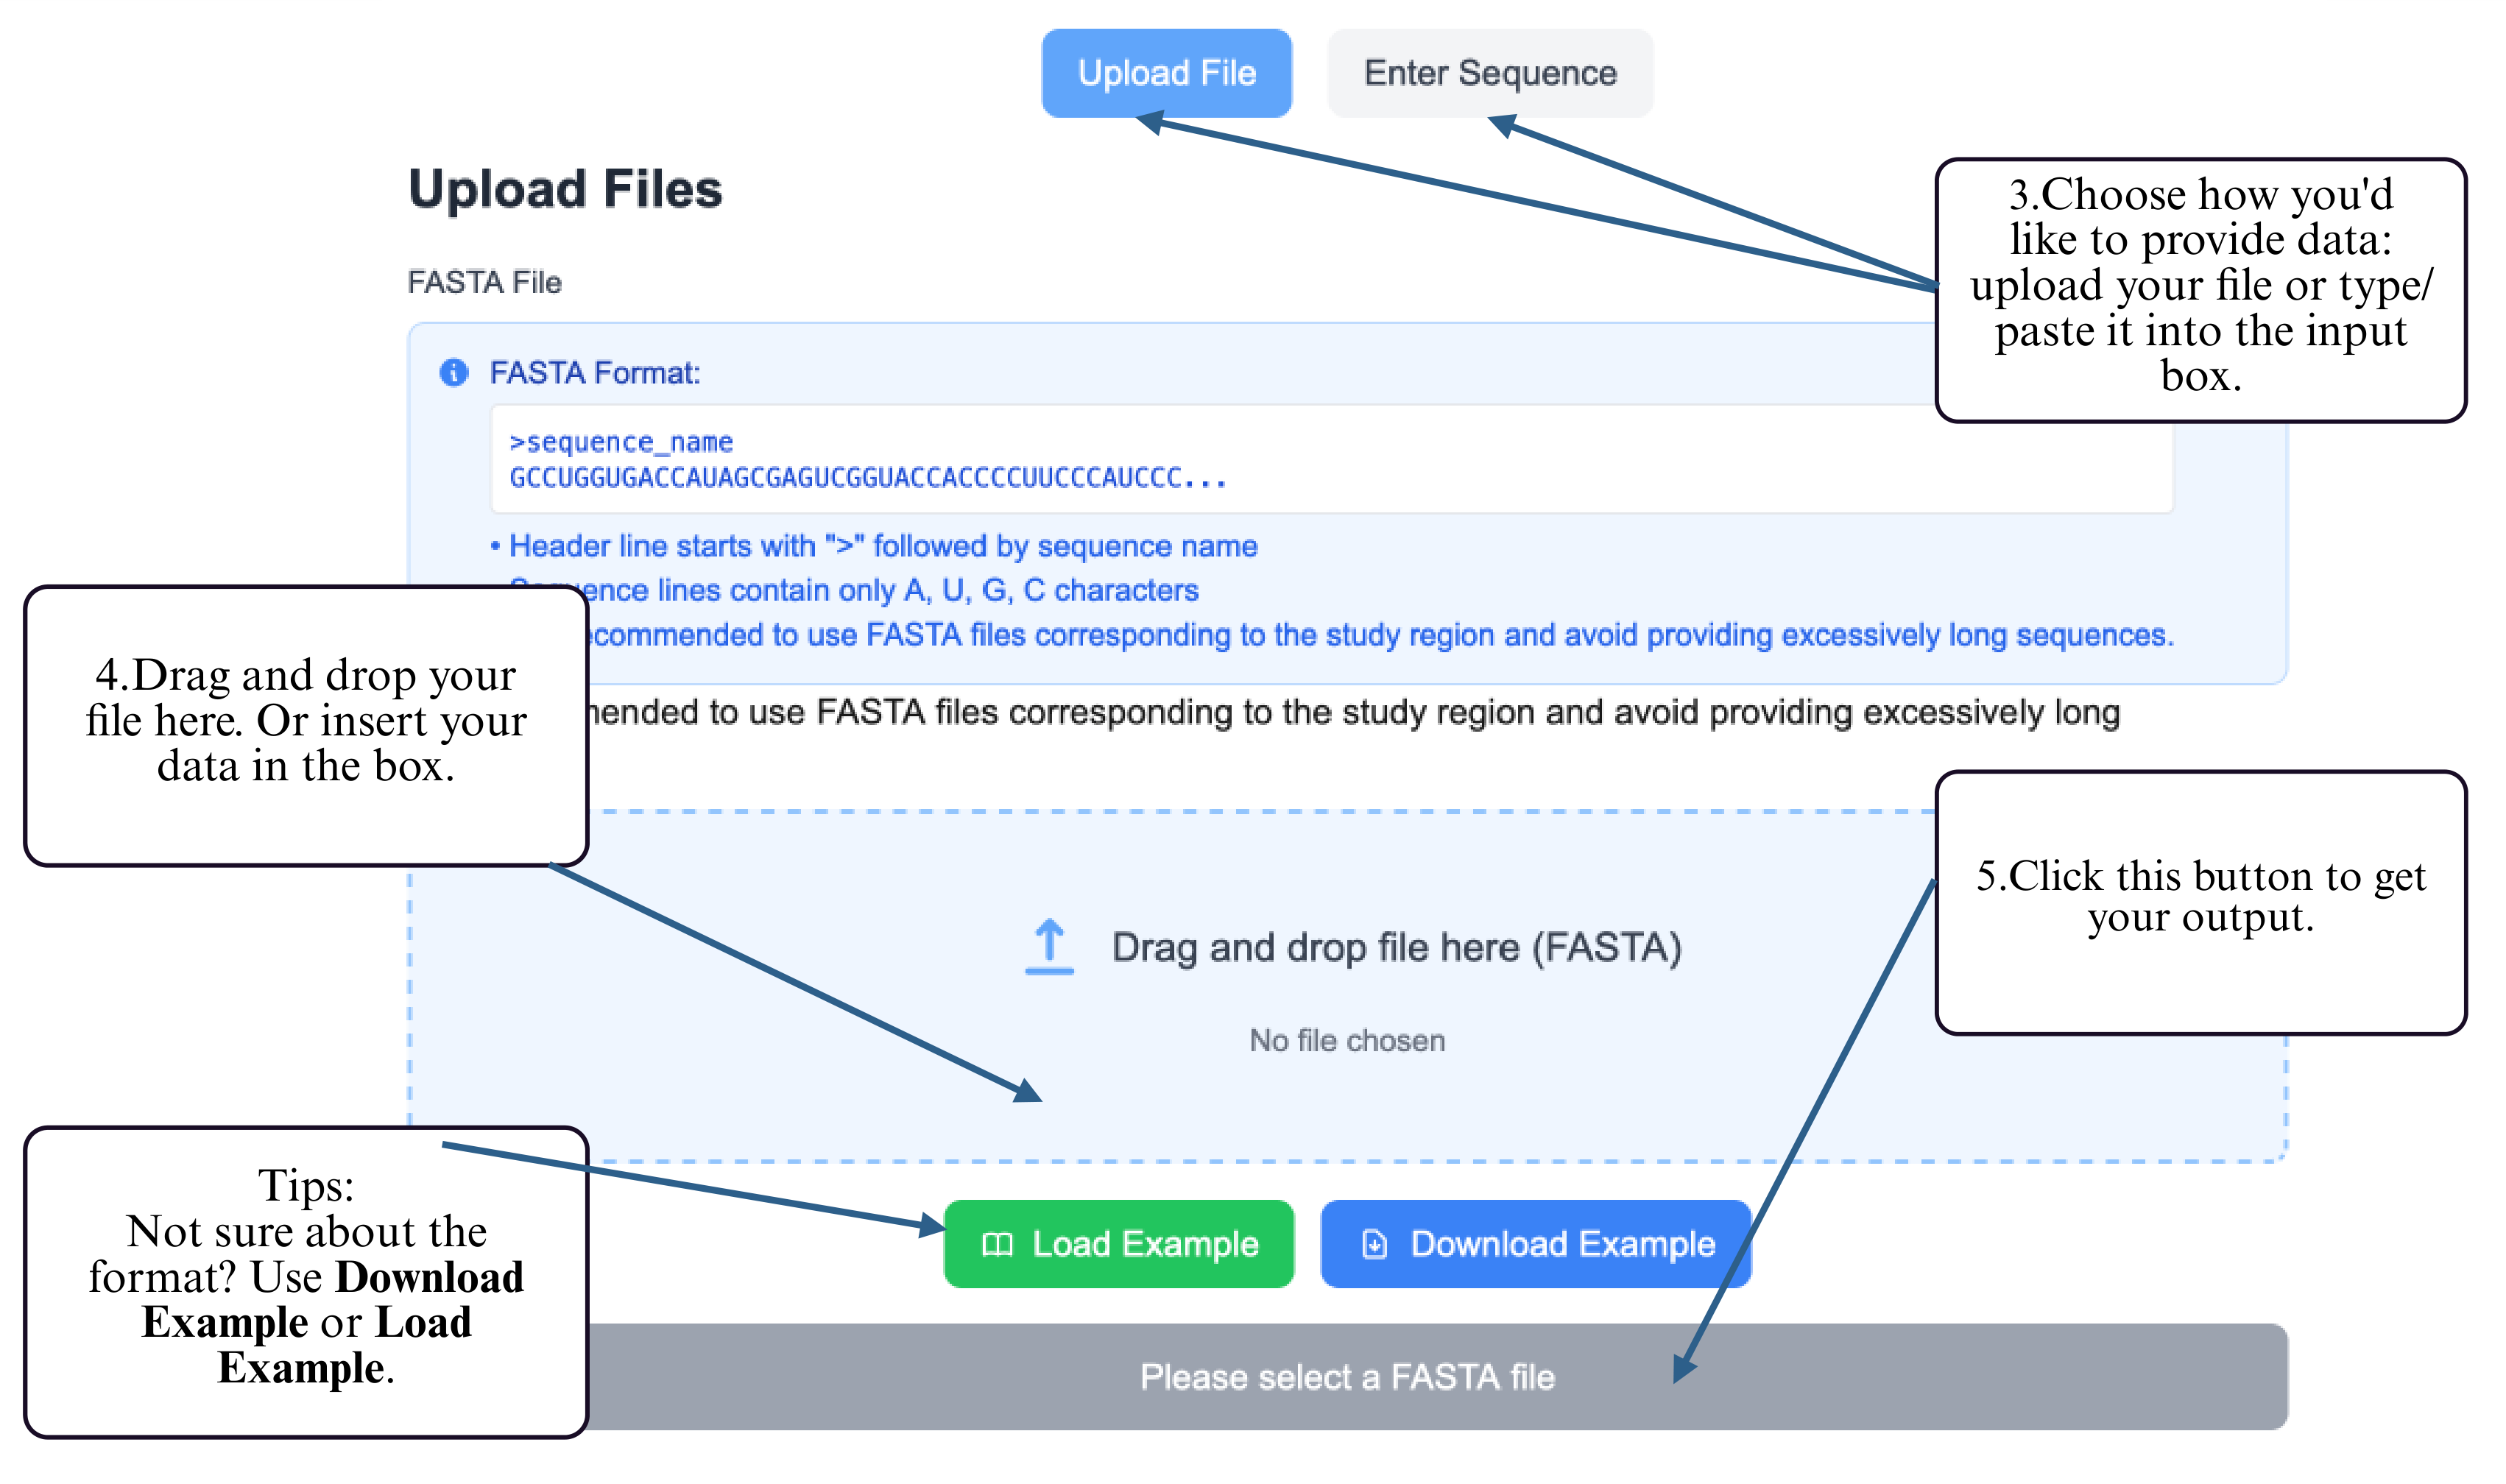
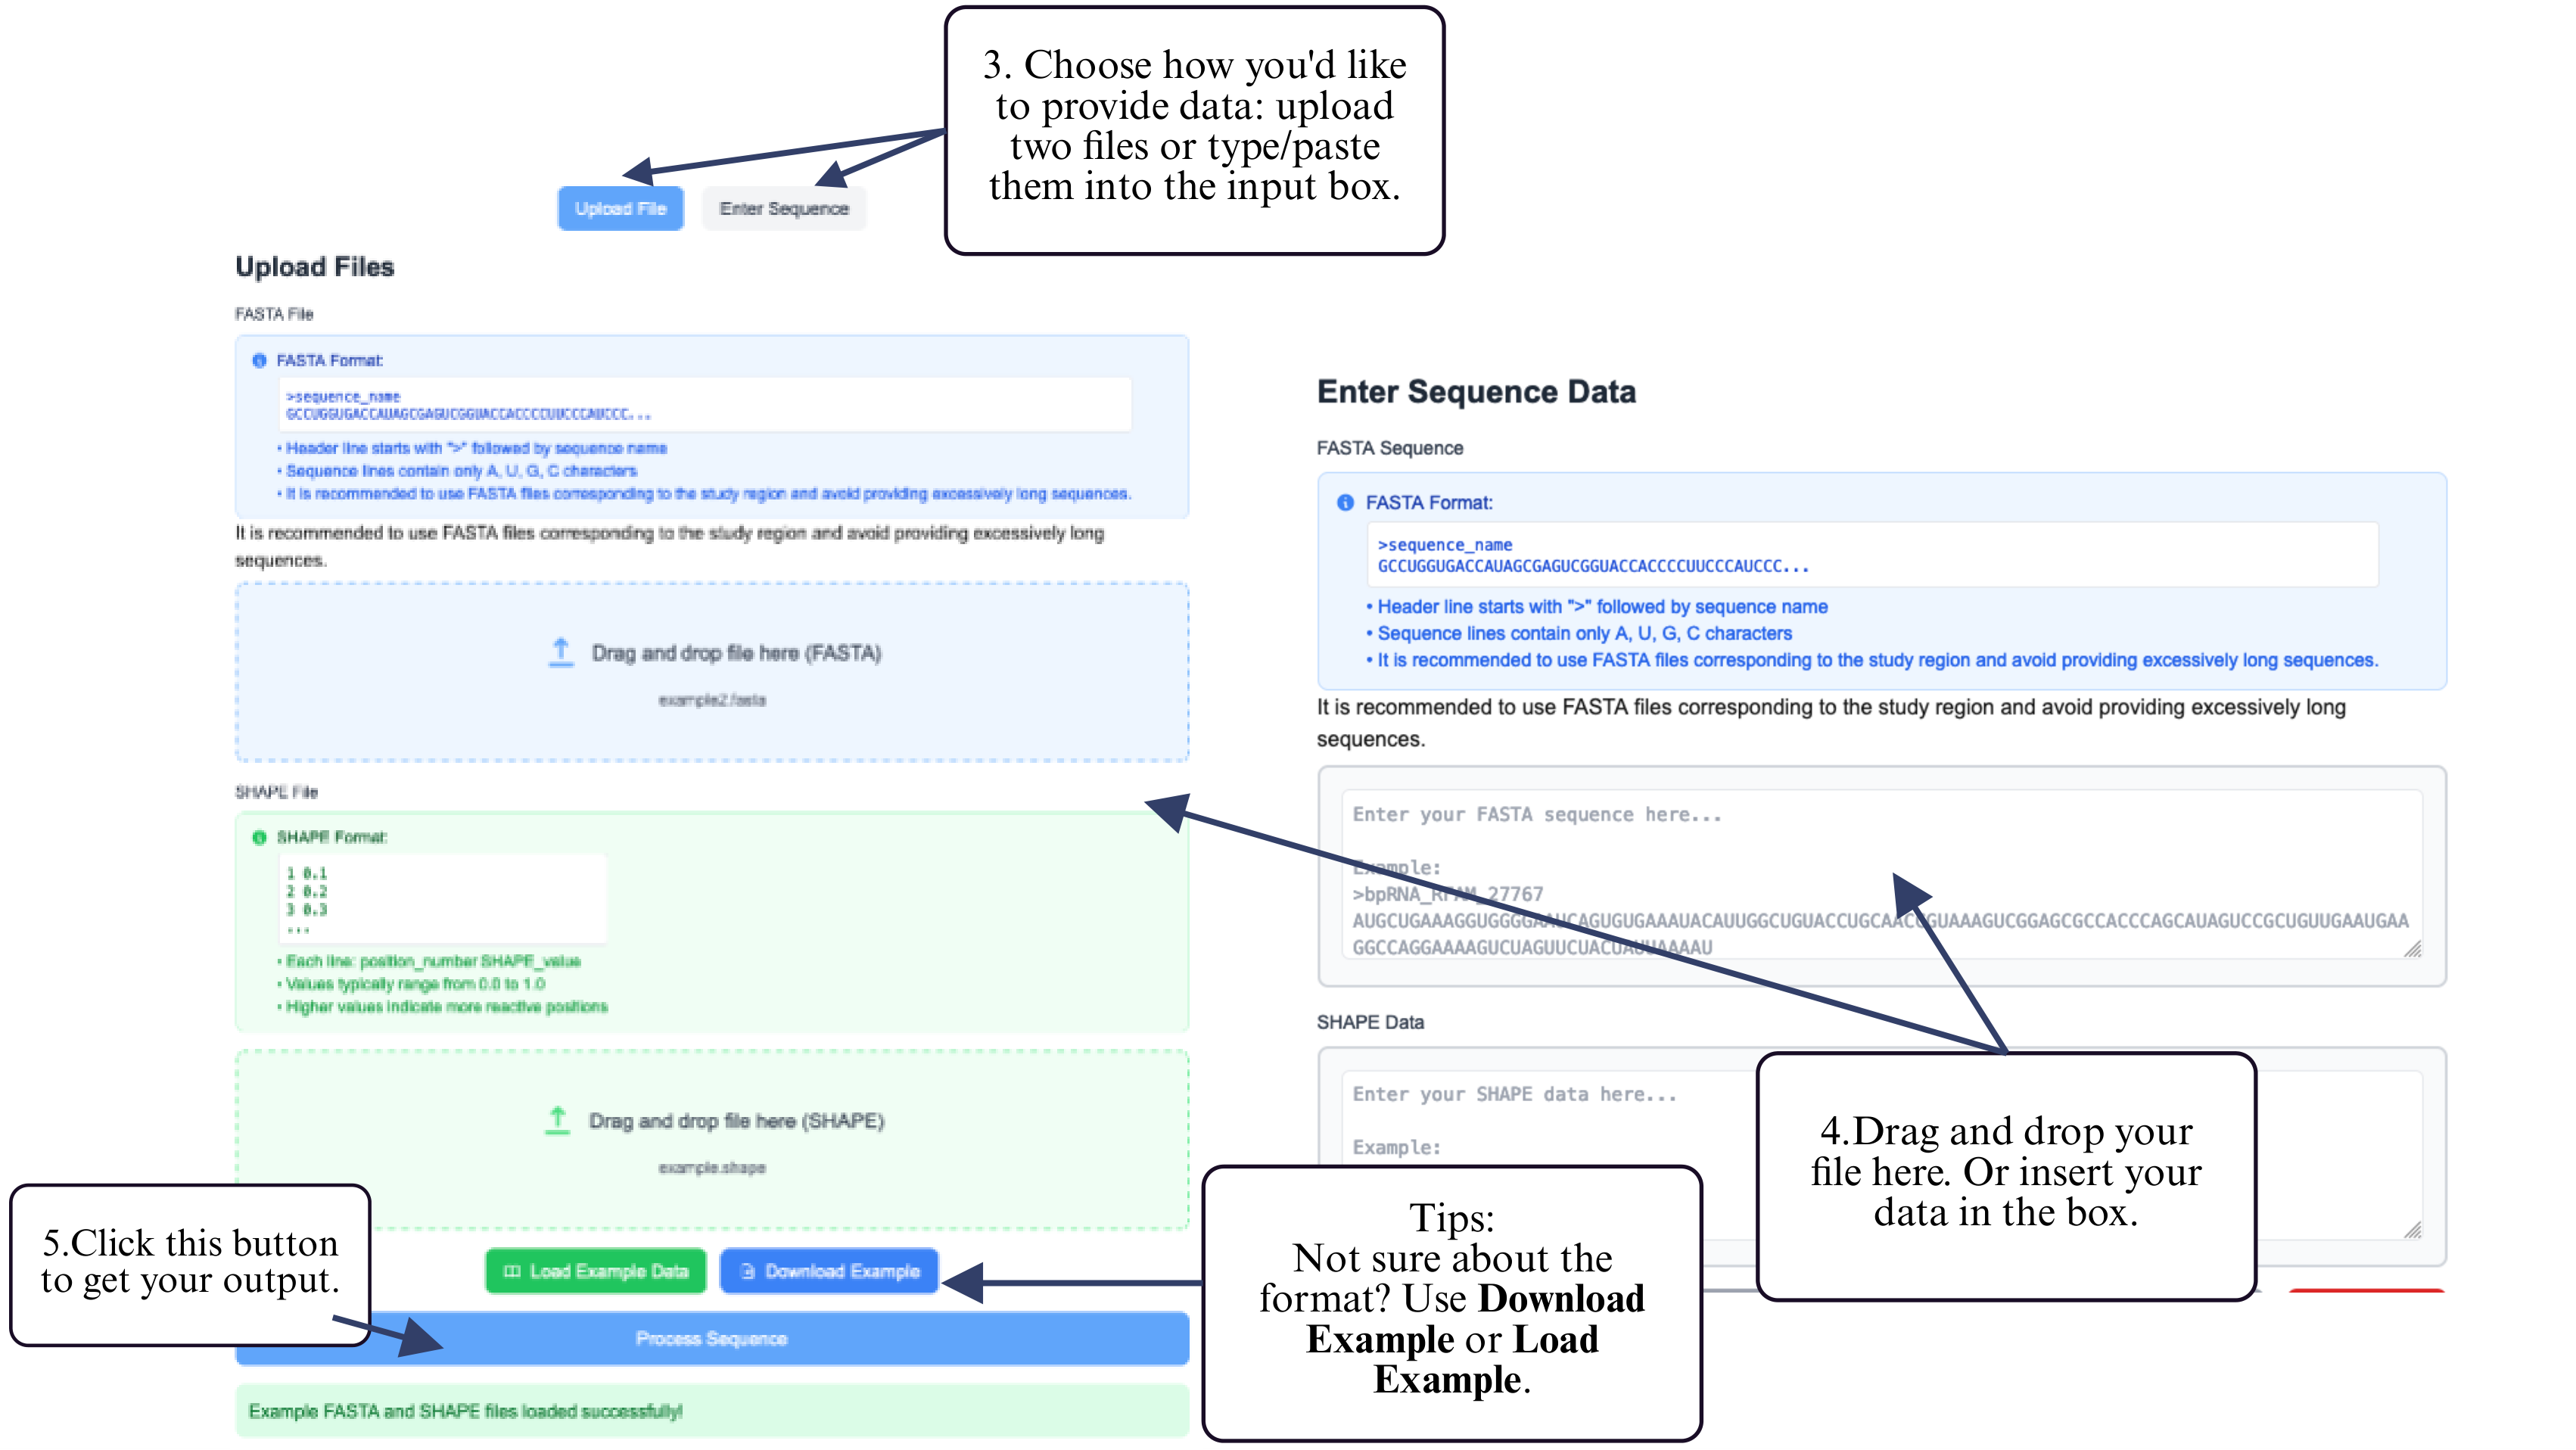
Step 3: Provide your RNA sequence — either by uploading a FASTA file or by typing/pasting the sequence into the input box.
Step 4: Click the Submit button to run the prediction.
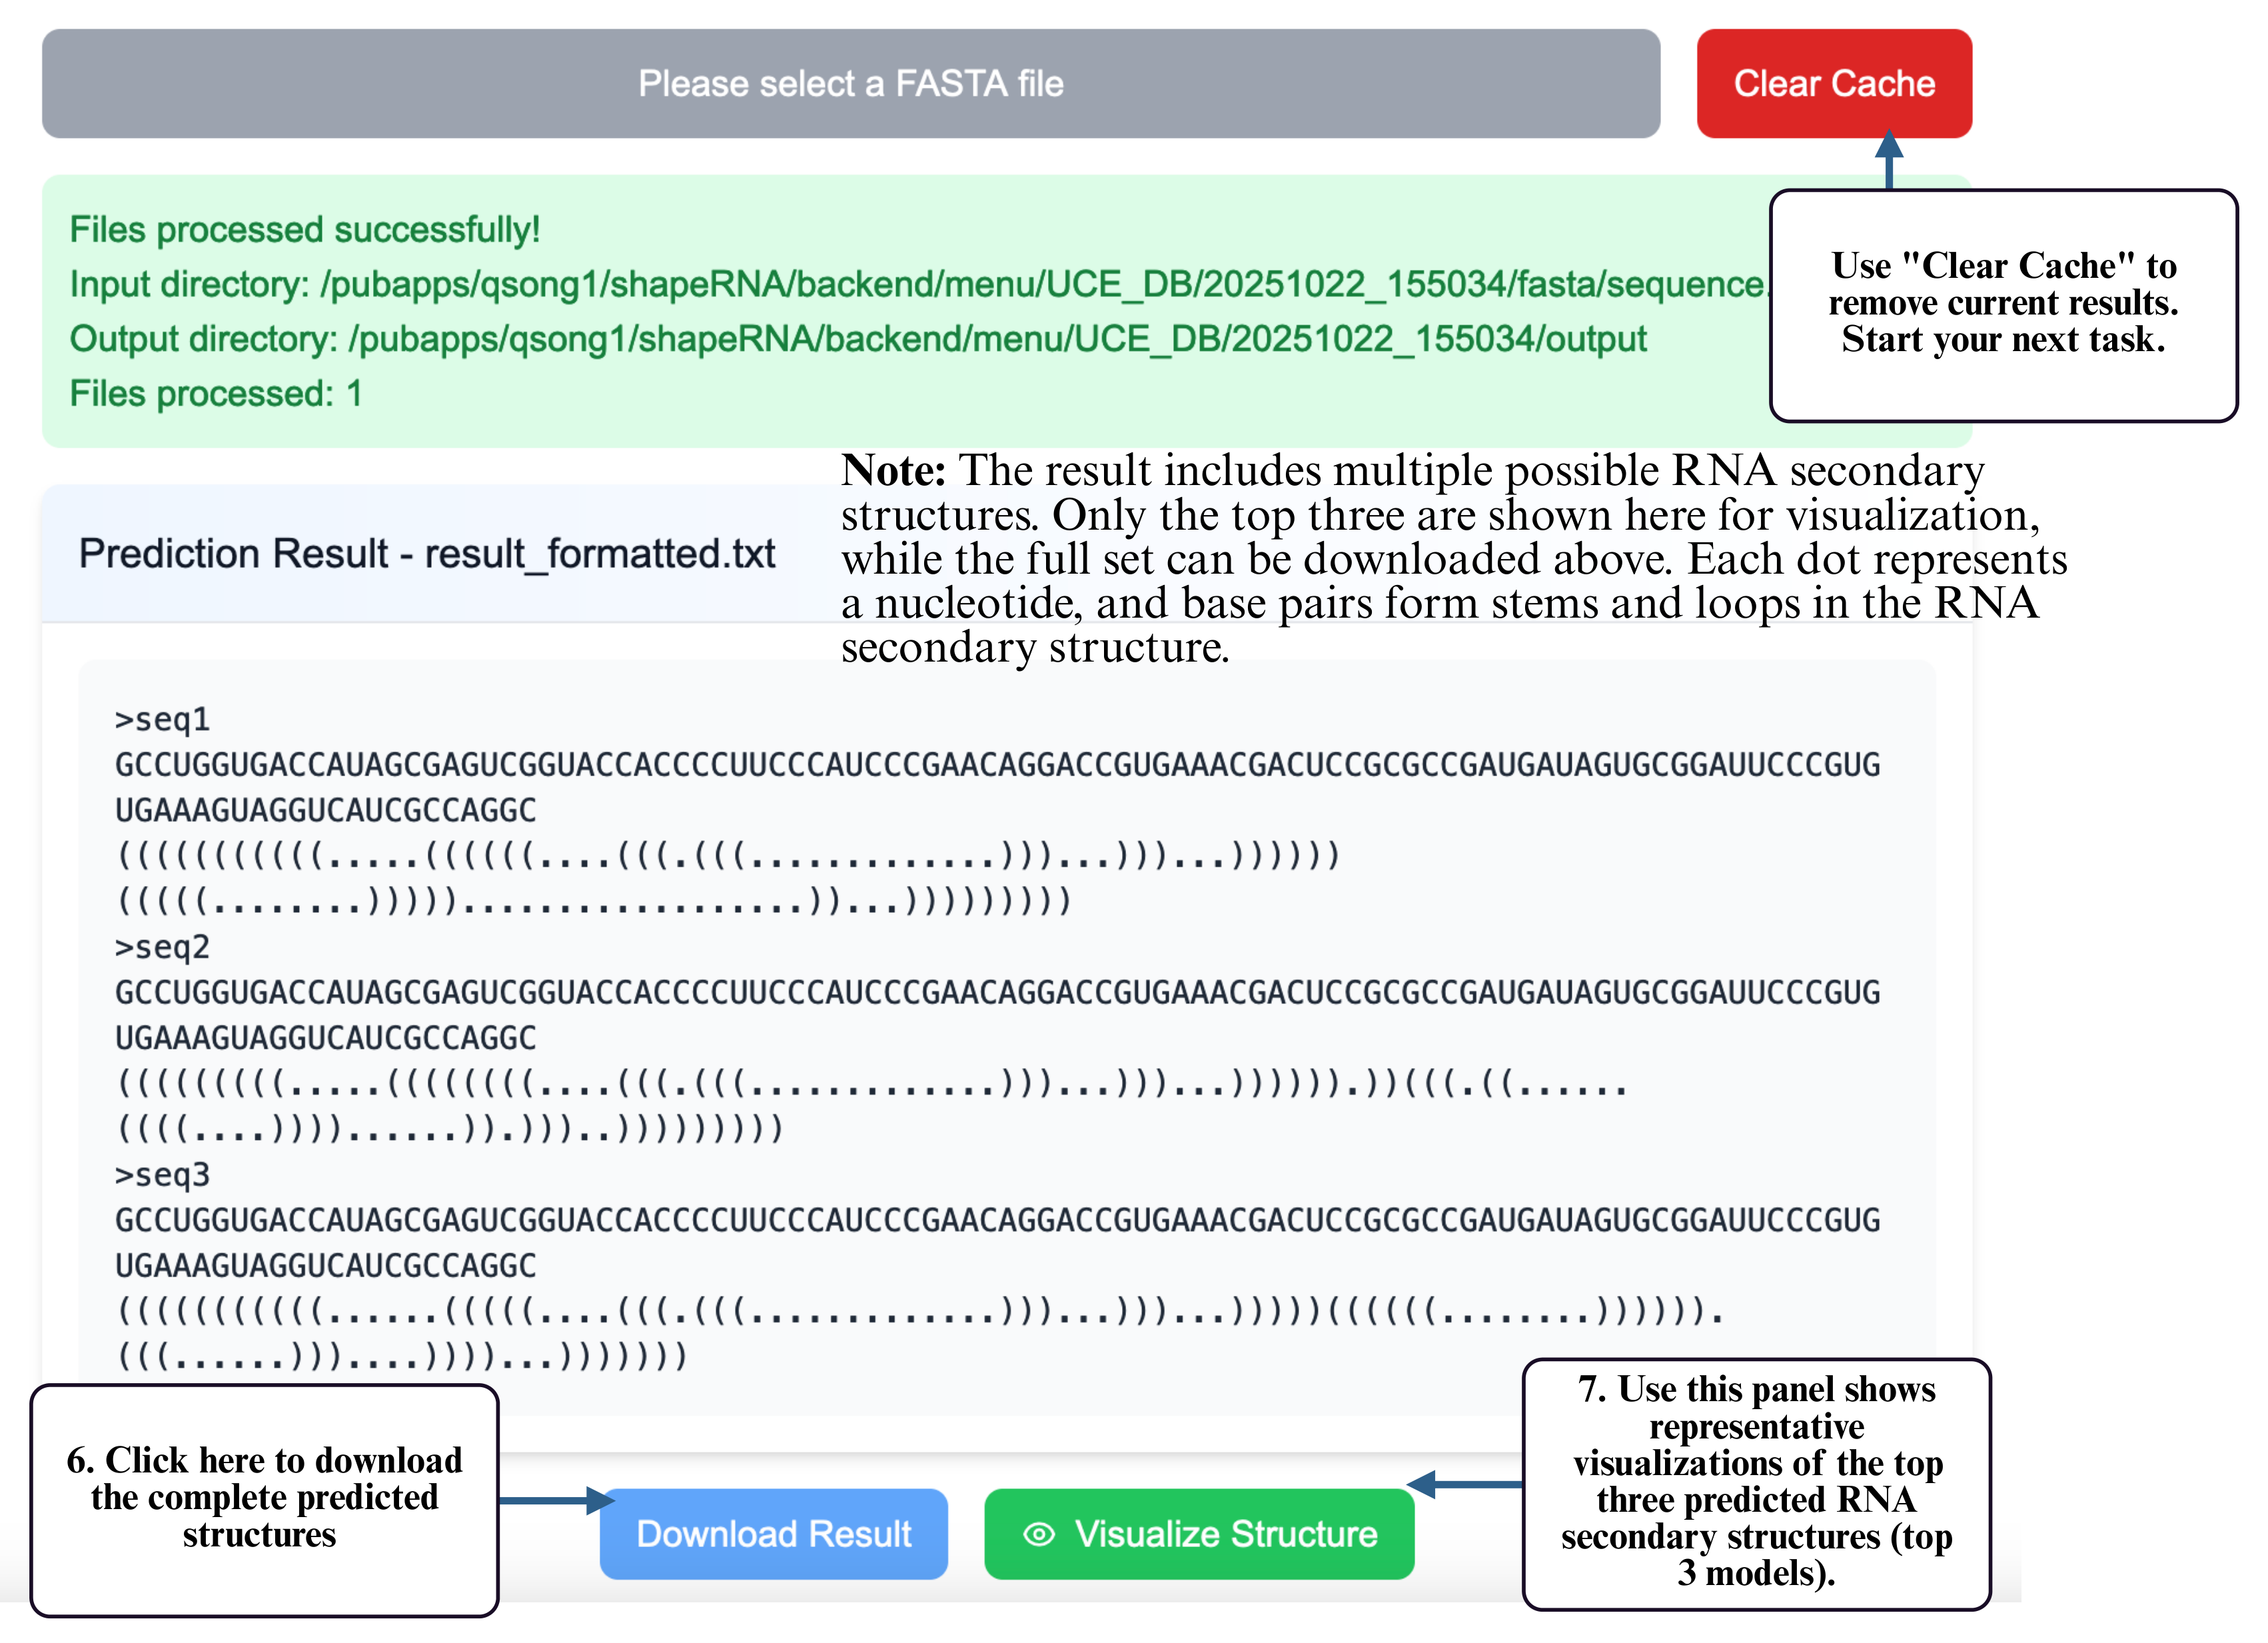
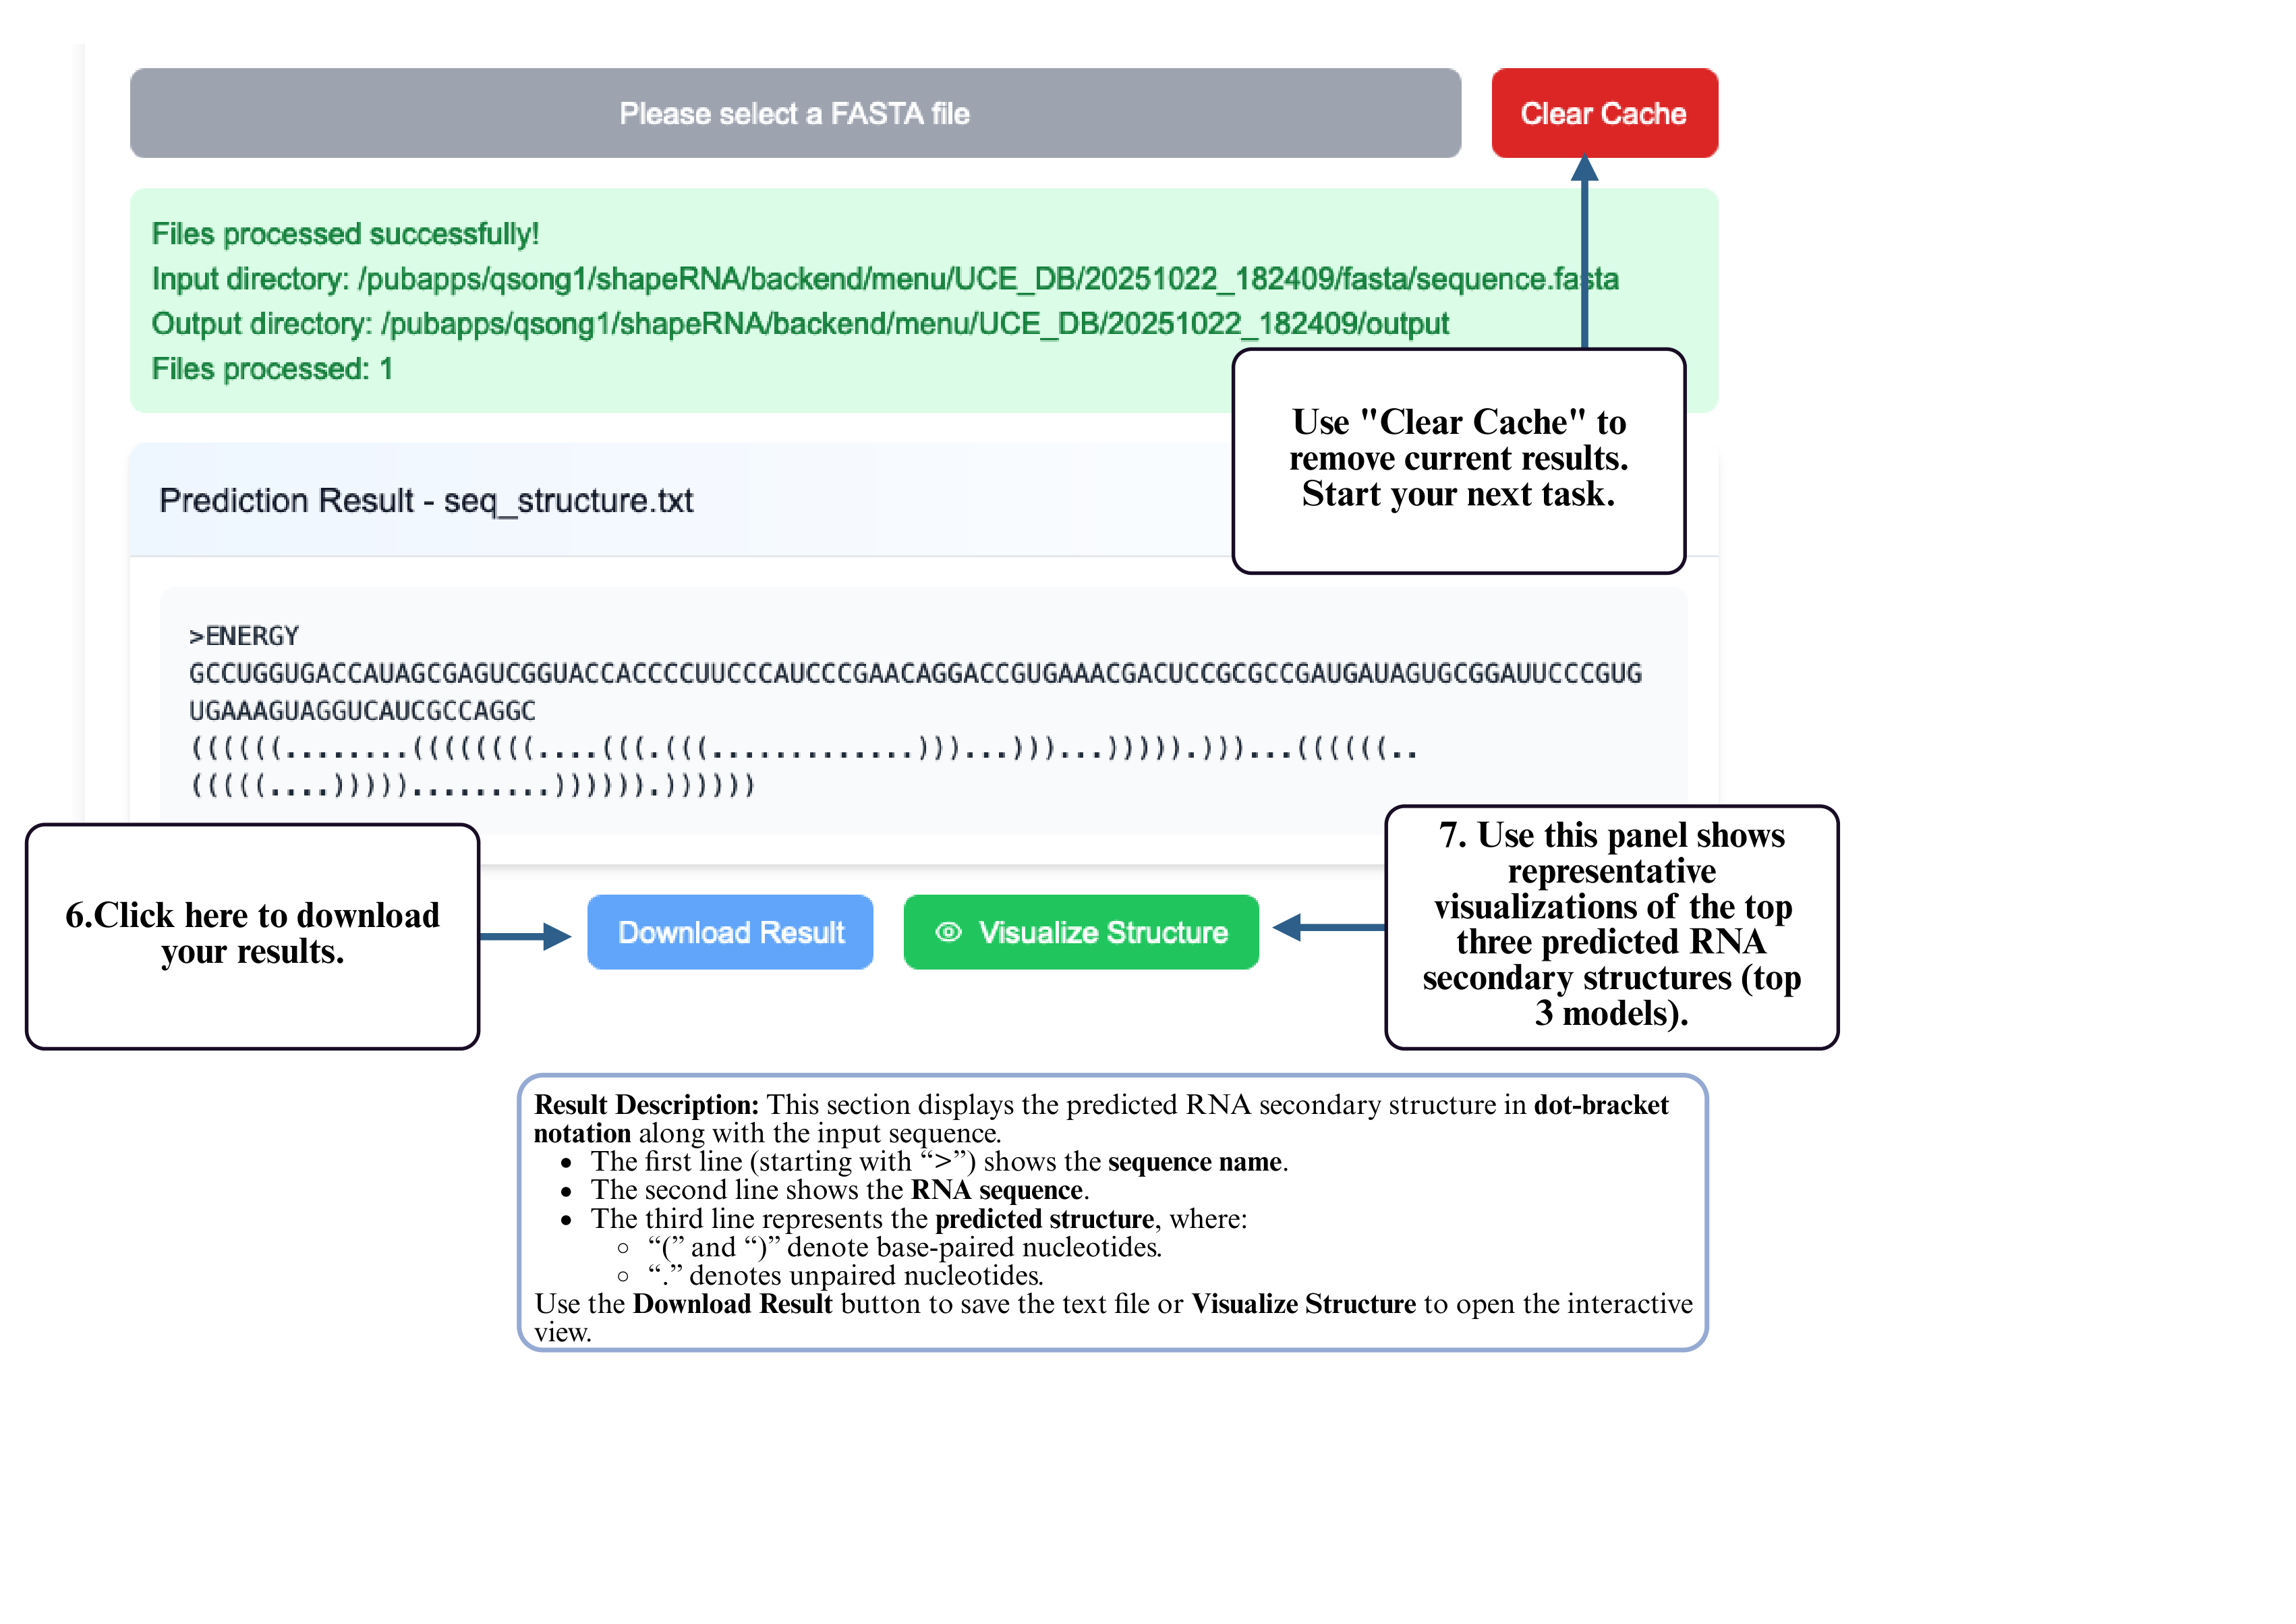
Step 5: Once completed, the predicted structure will be displayed and available for download.
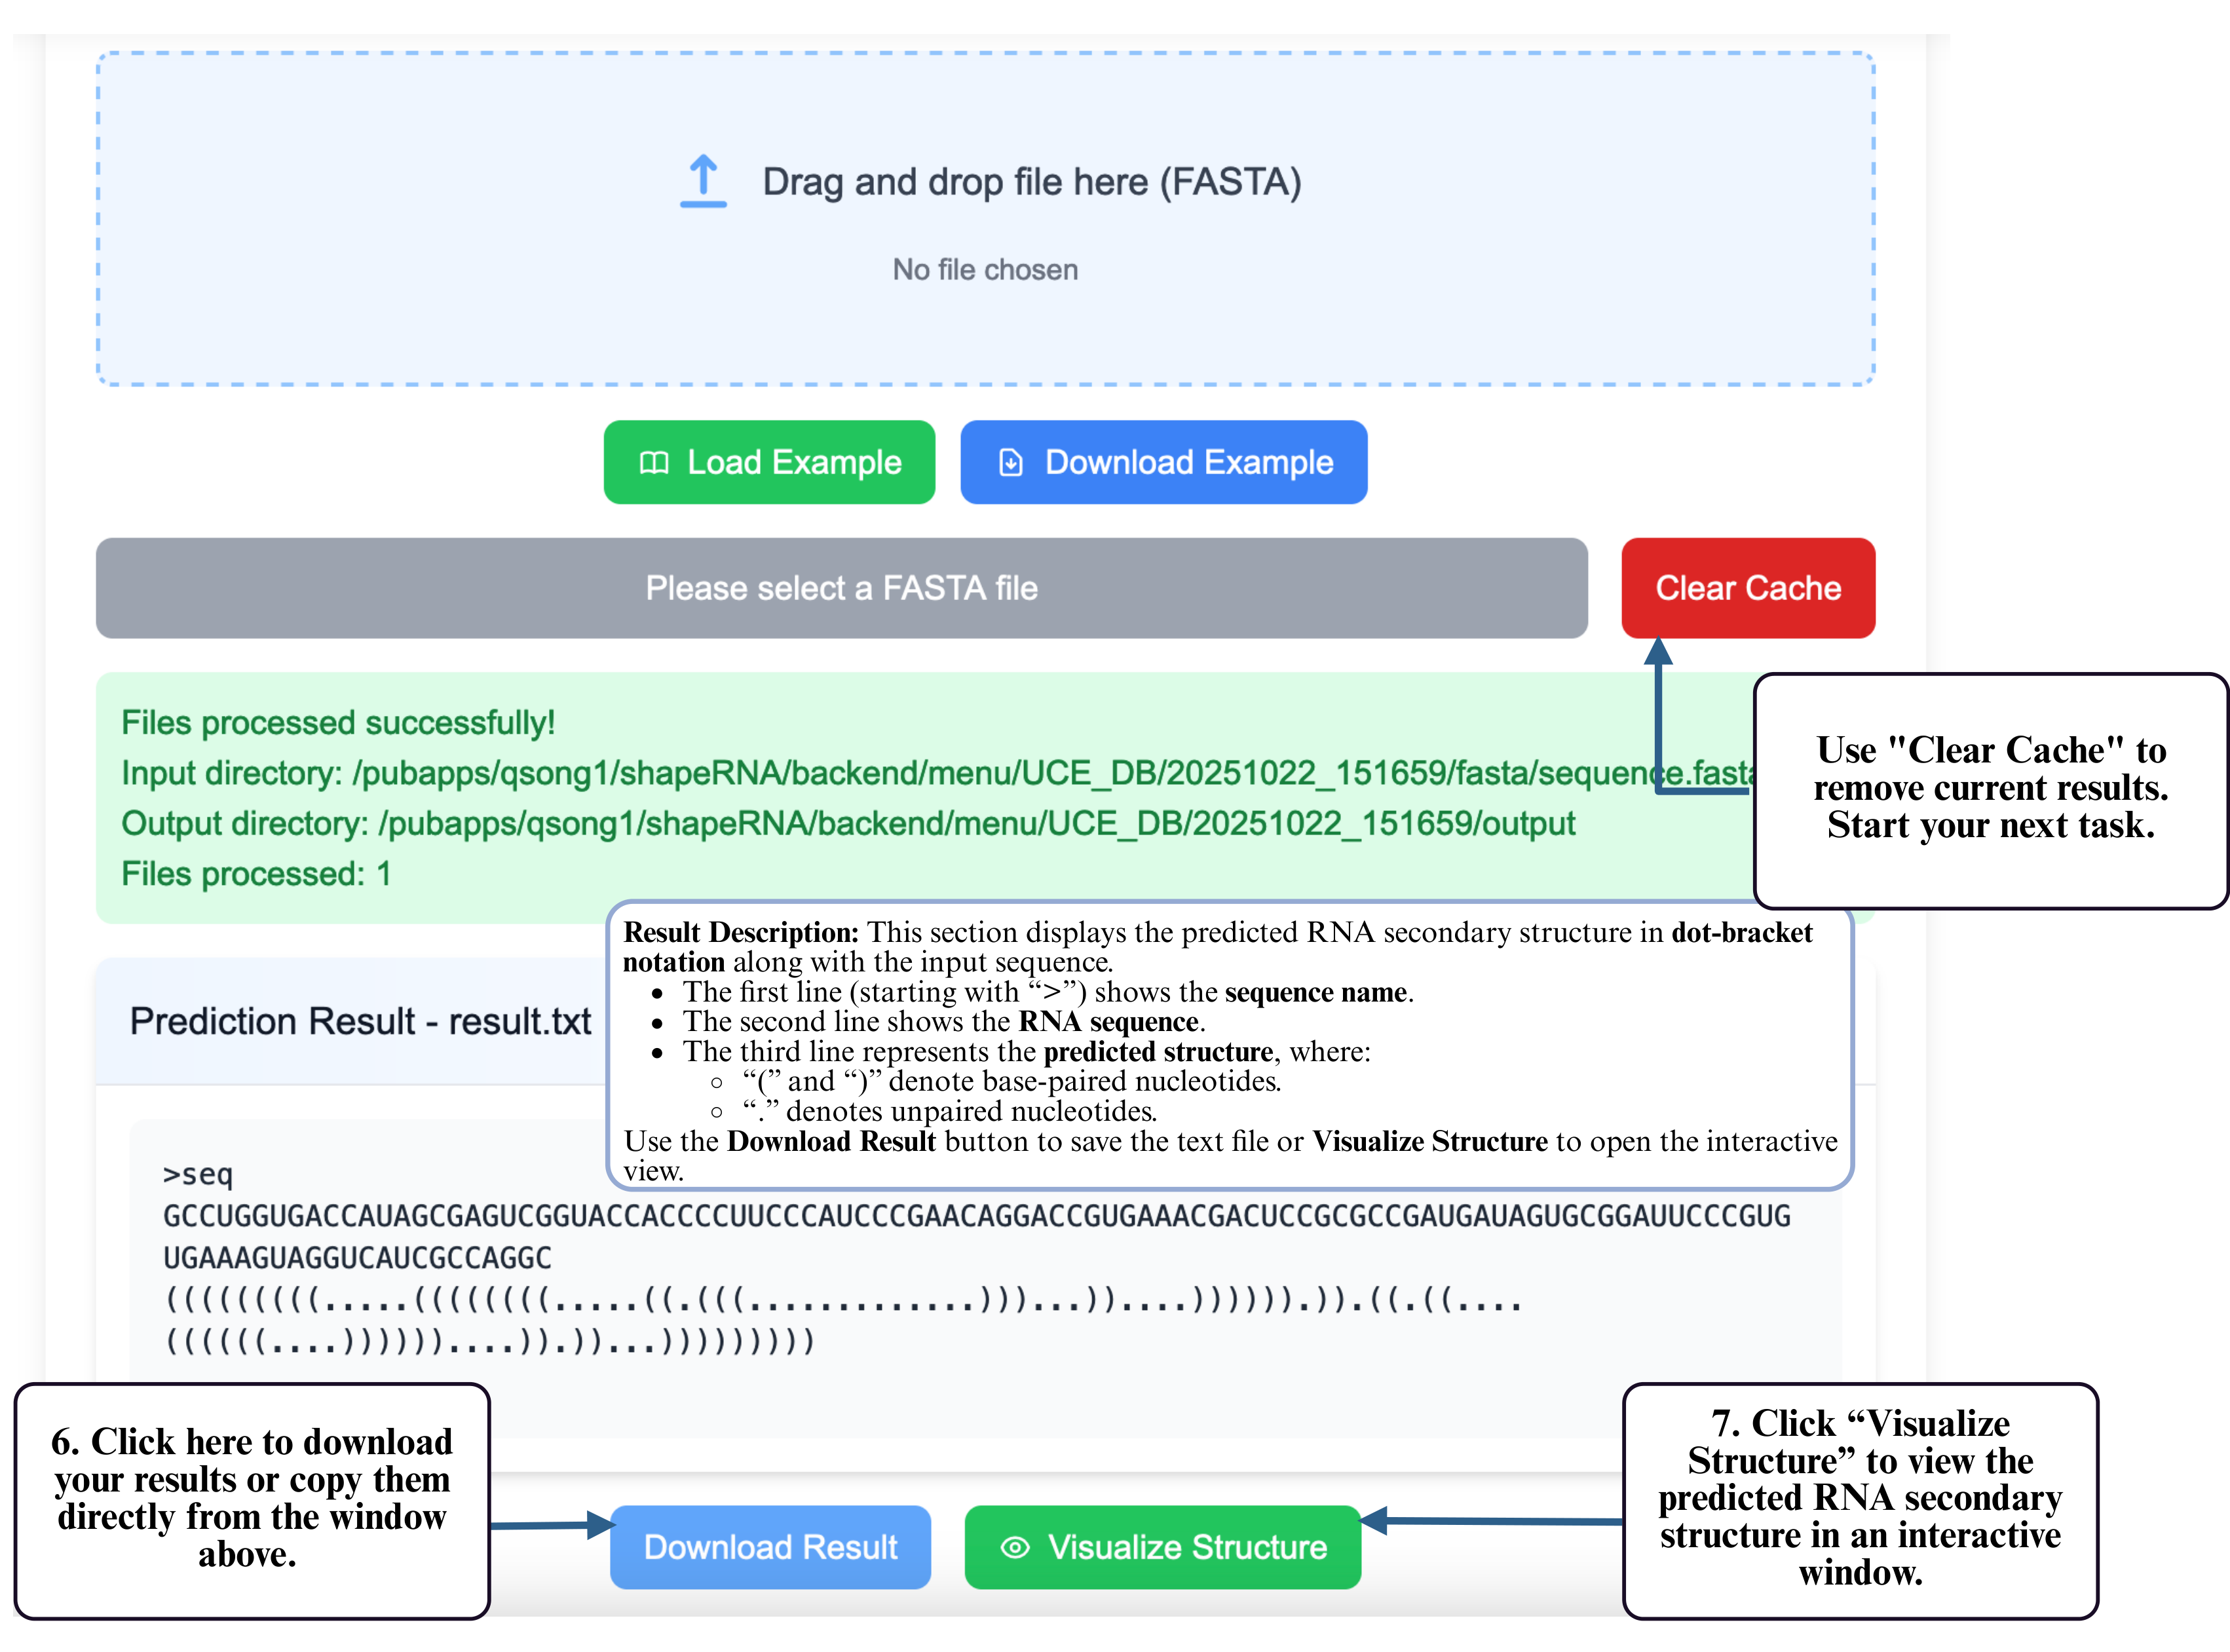
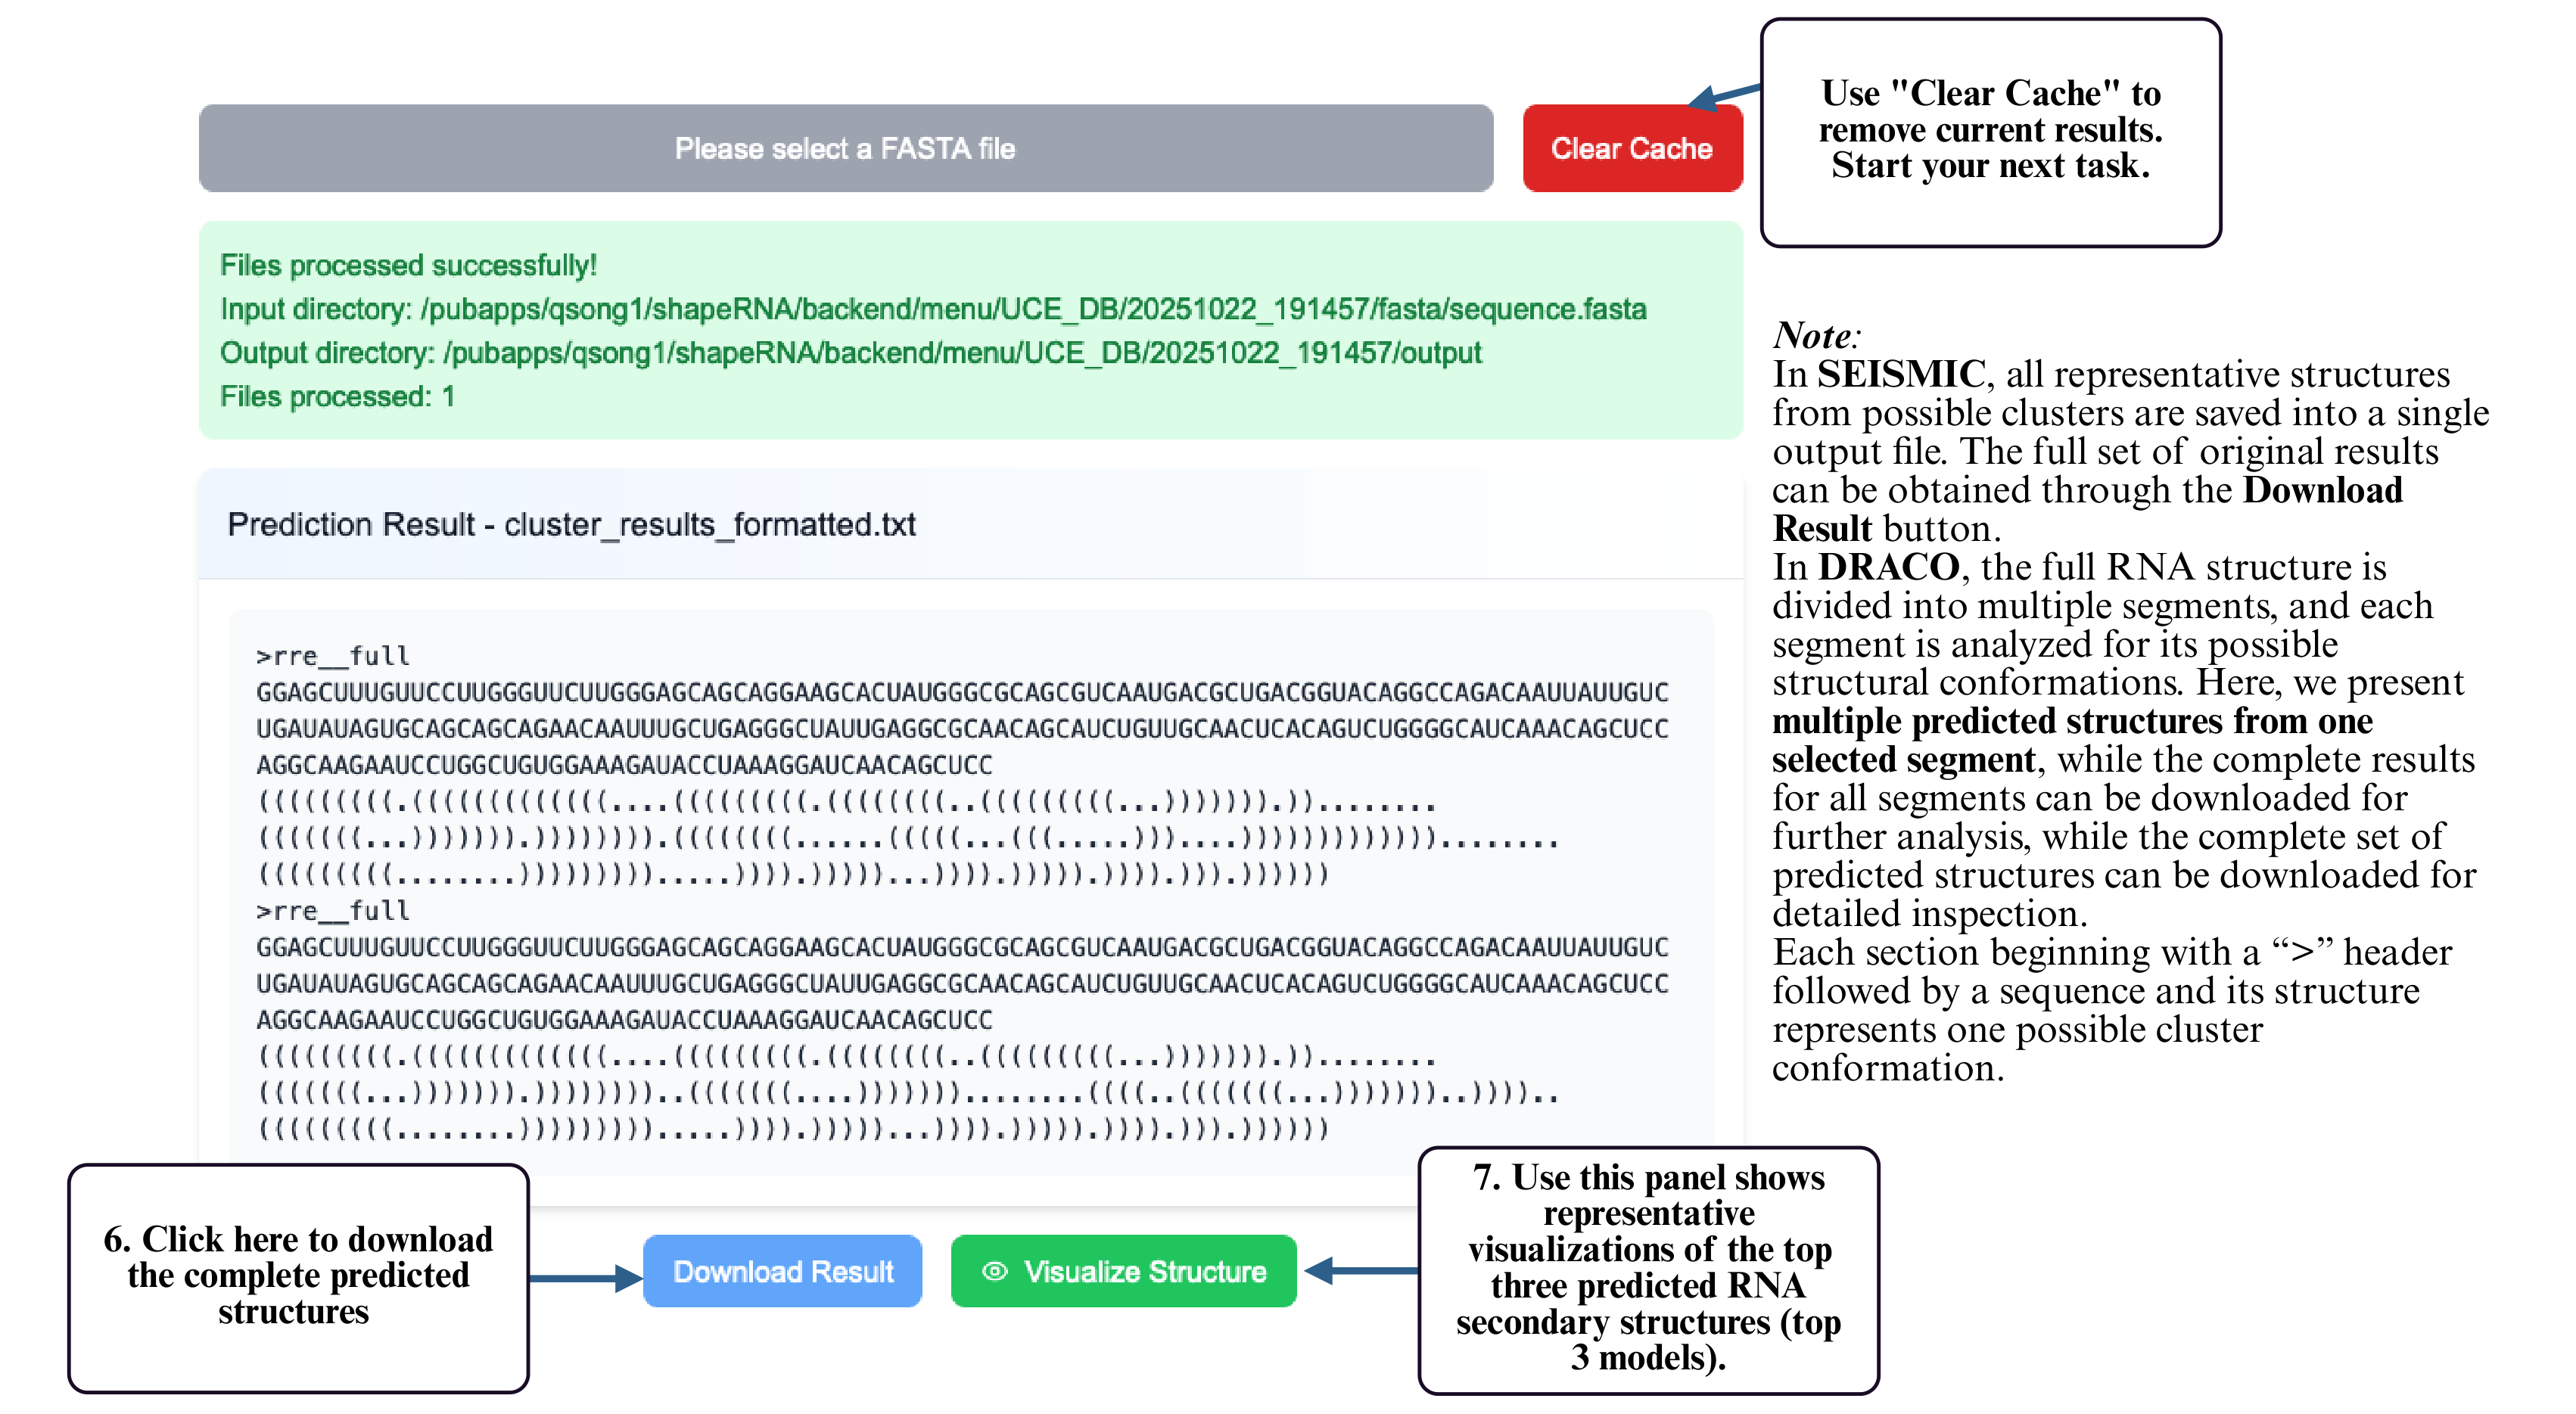
Step 6: After the job completes, click the download button to retrieve your predicted structure. (Optional) Use Clear Cache to remove the current results and begin a new task.
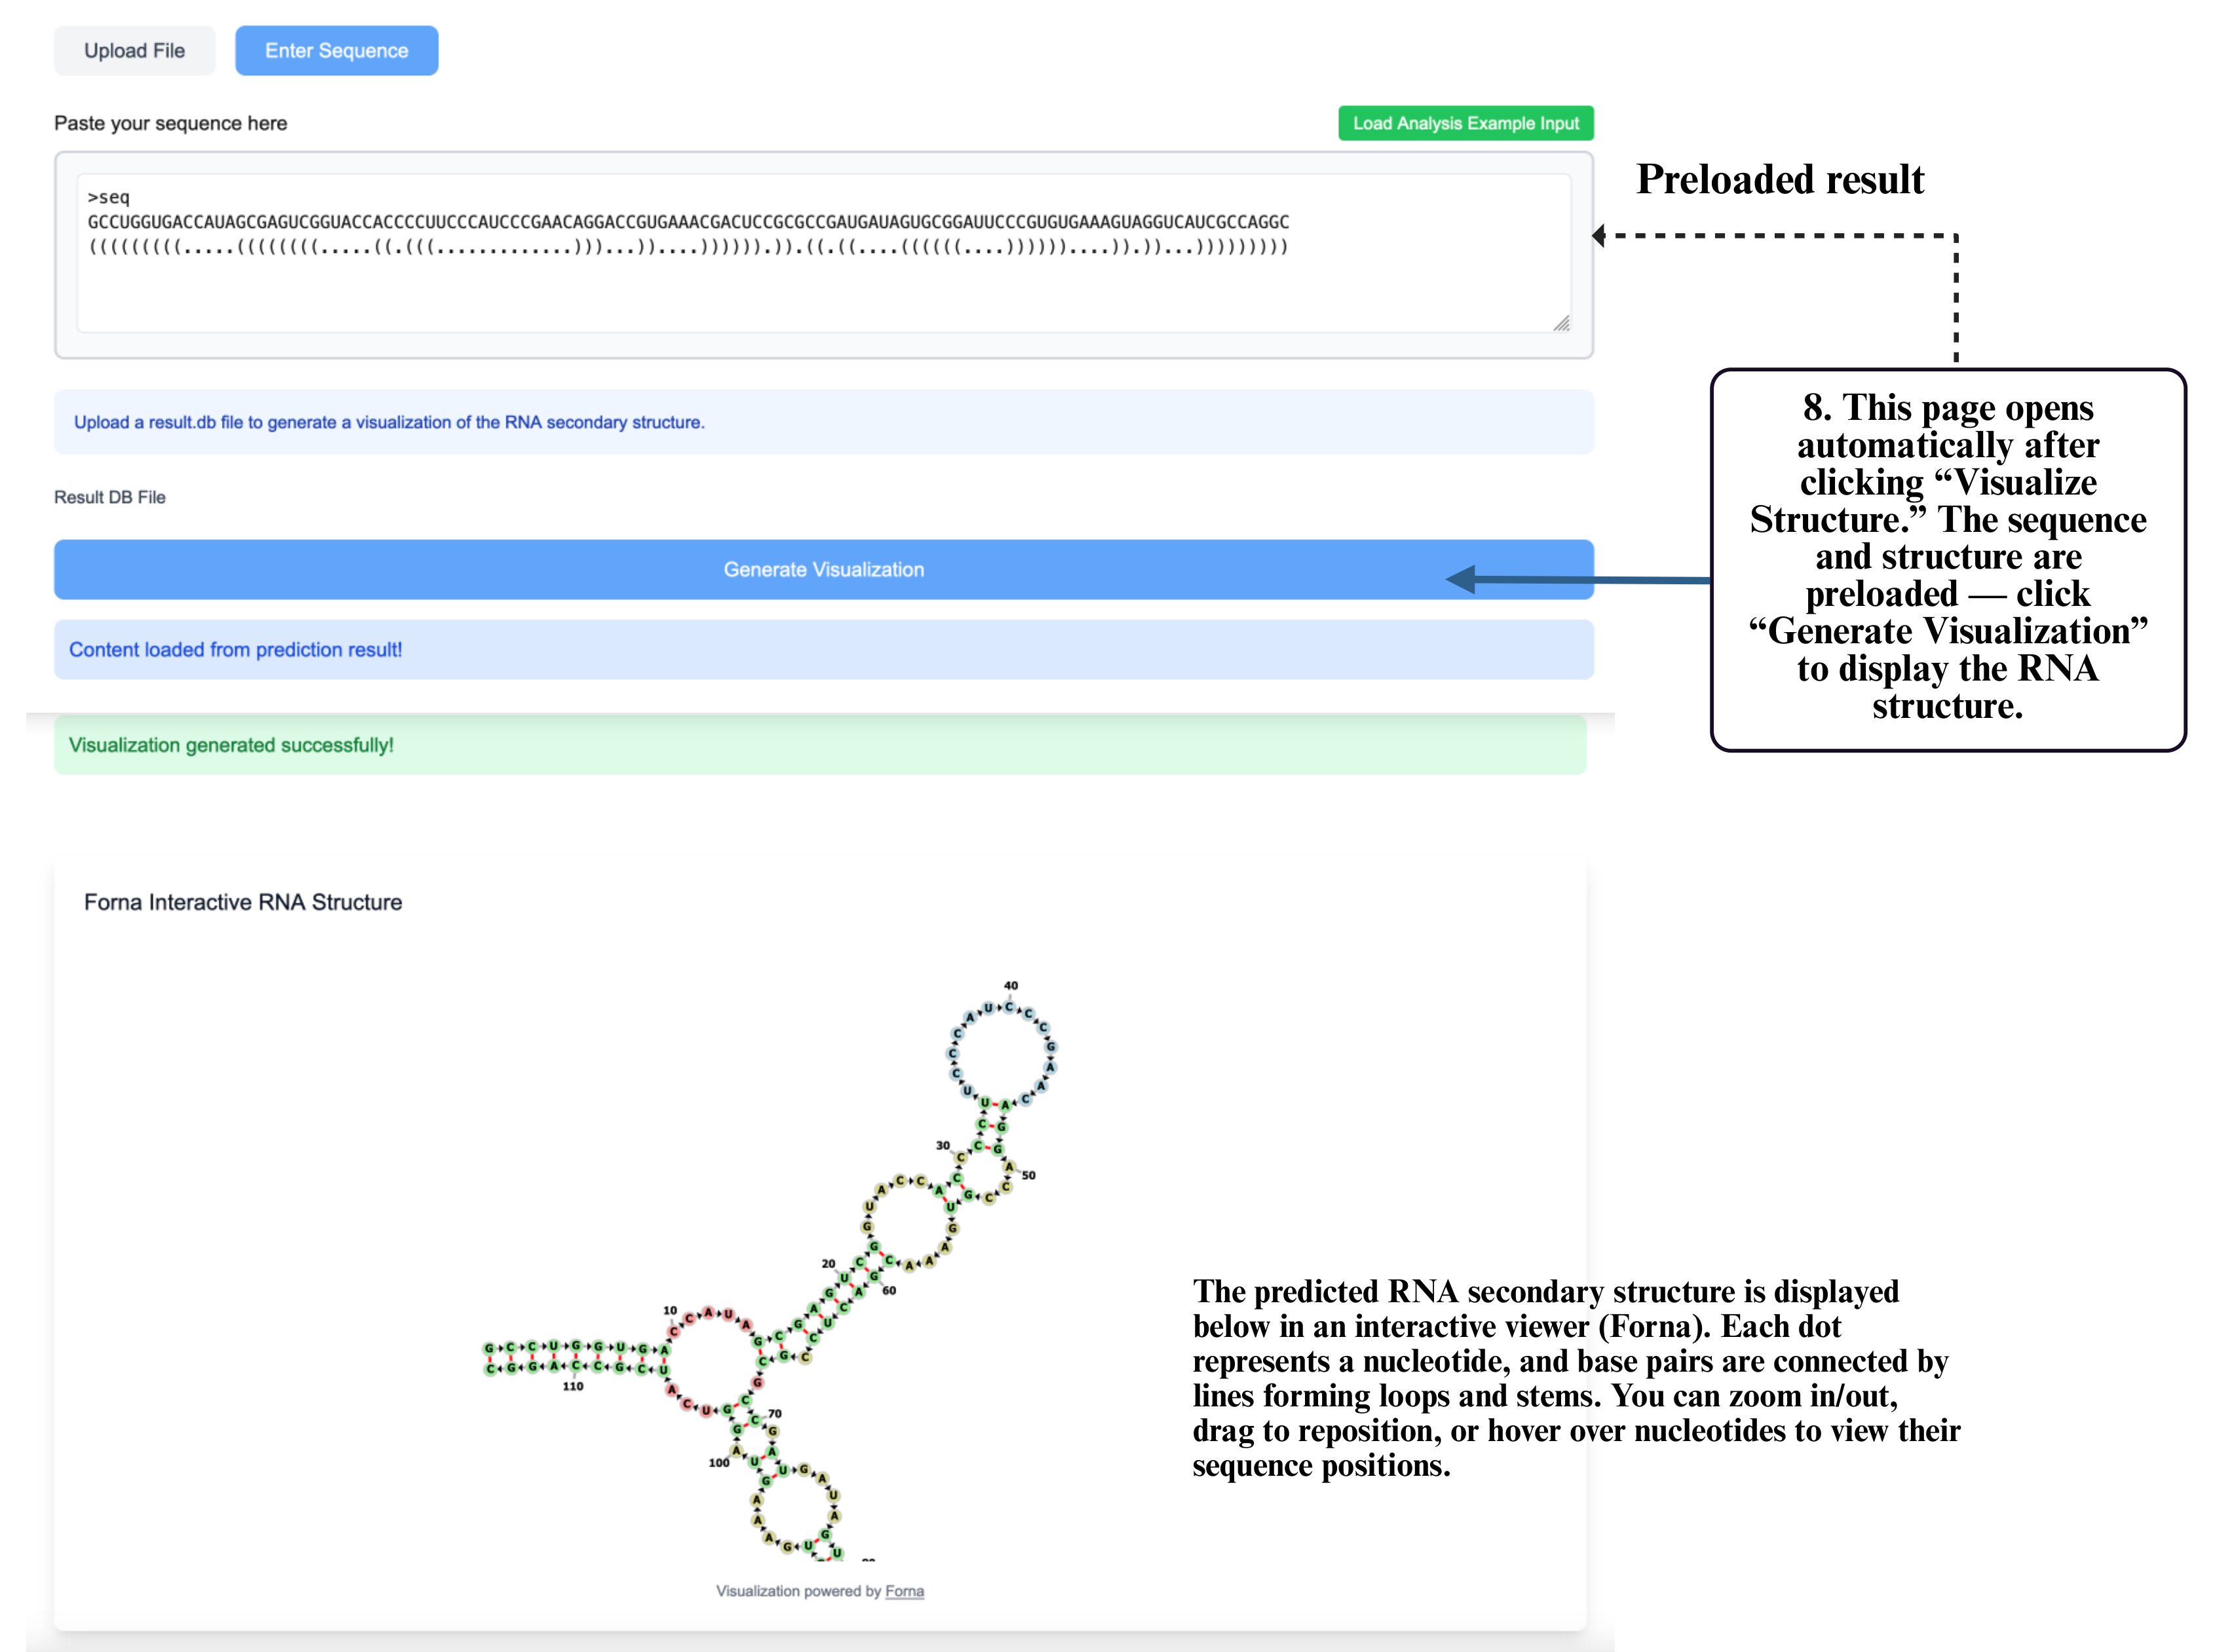
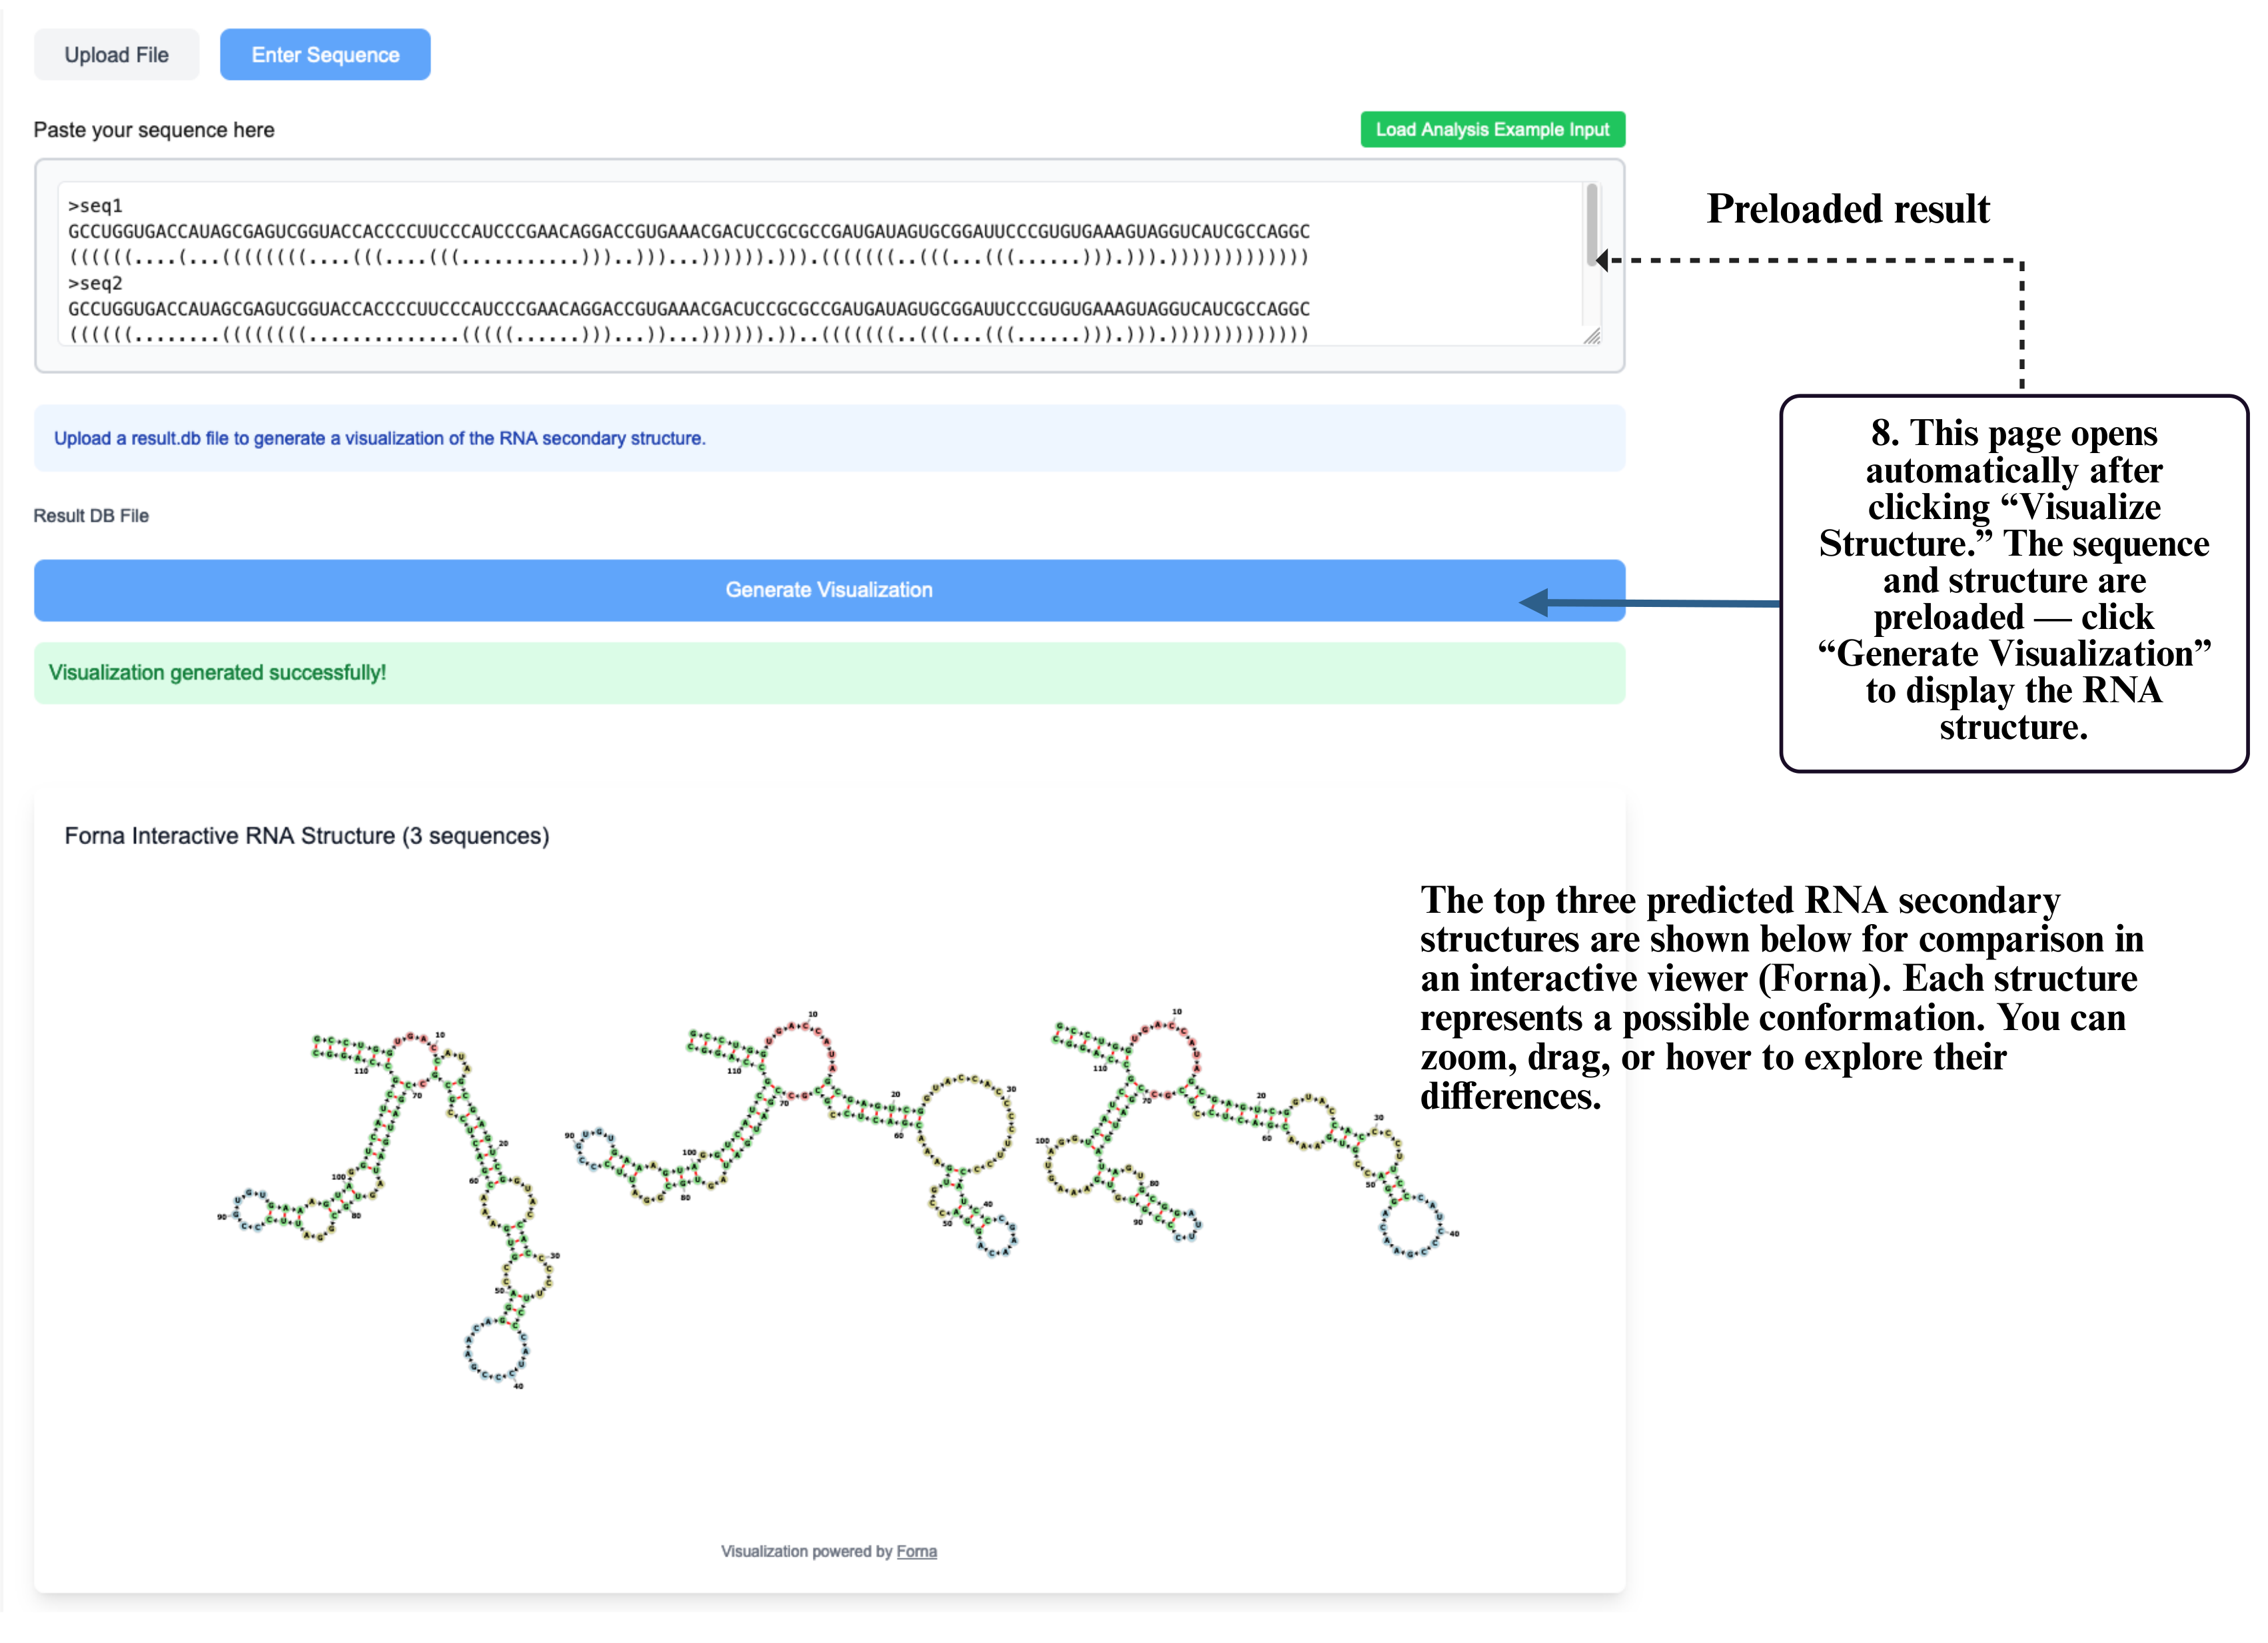
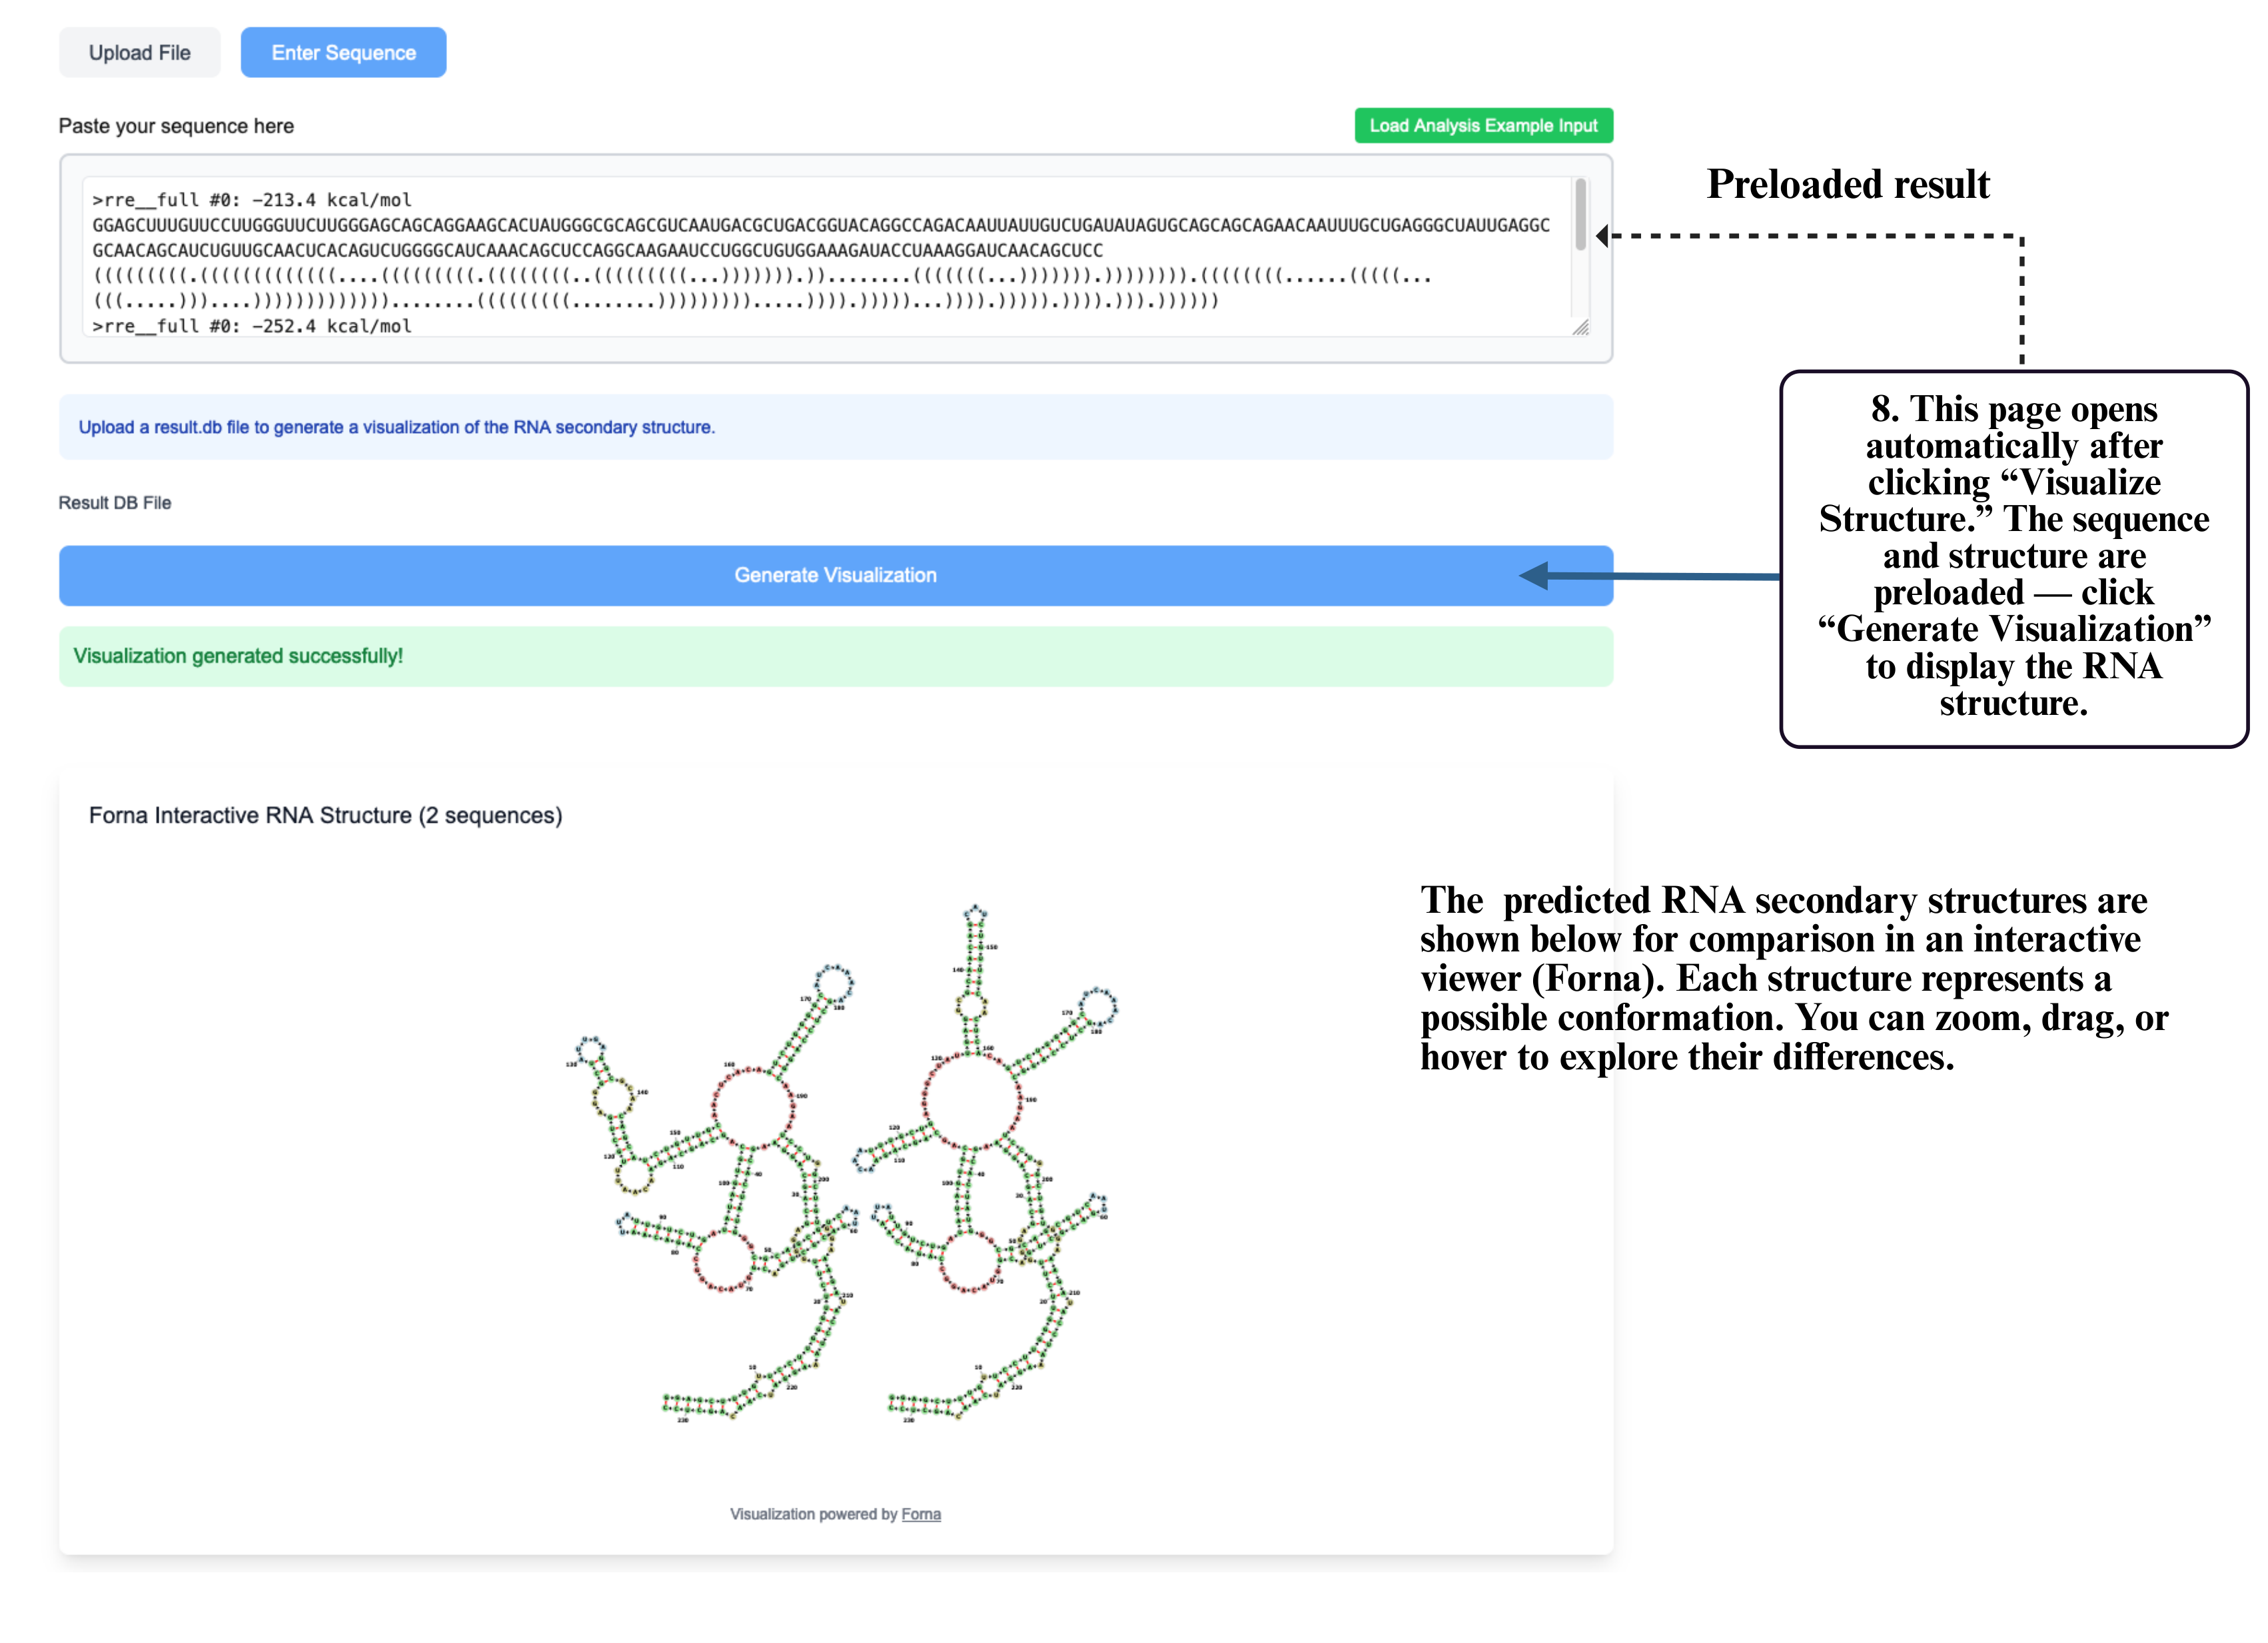
Step 7: You can also click Visualize Structure to open the interactive visualization tool and inspect your predicted RNA structure directly in the browser.
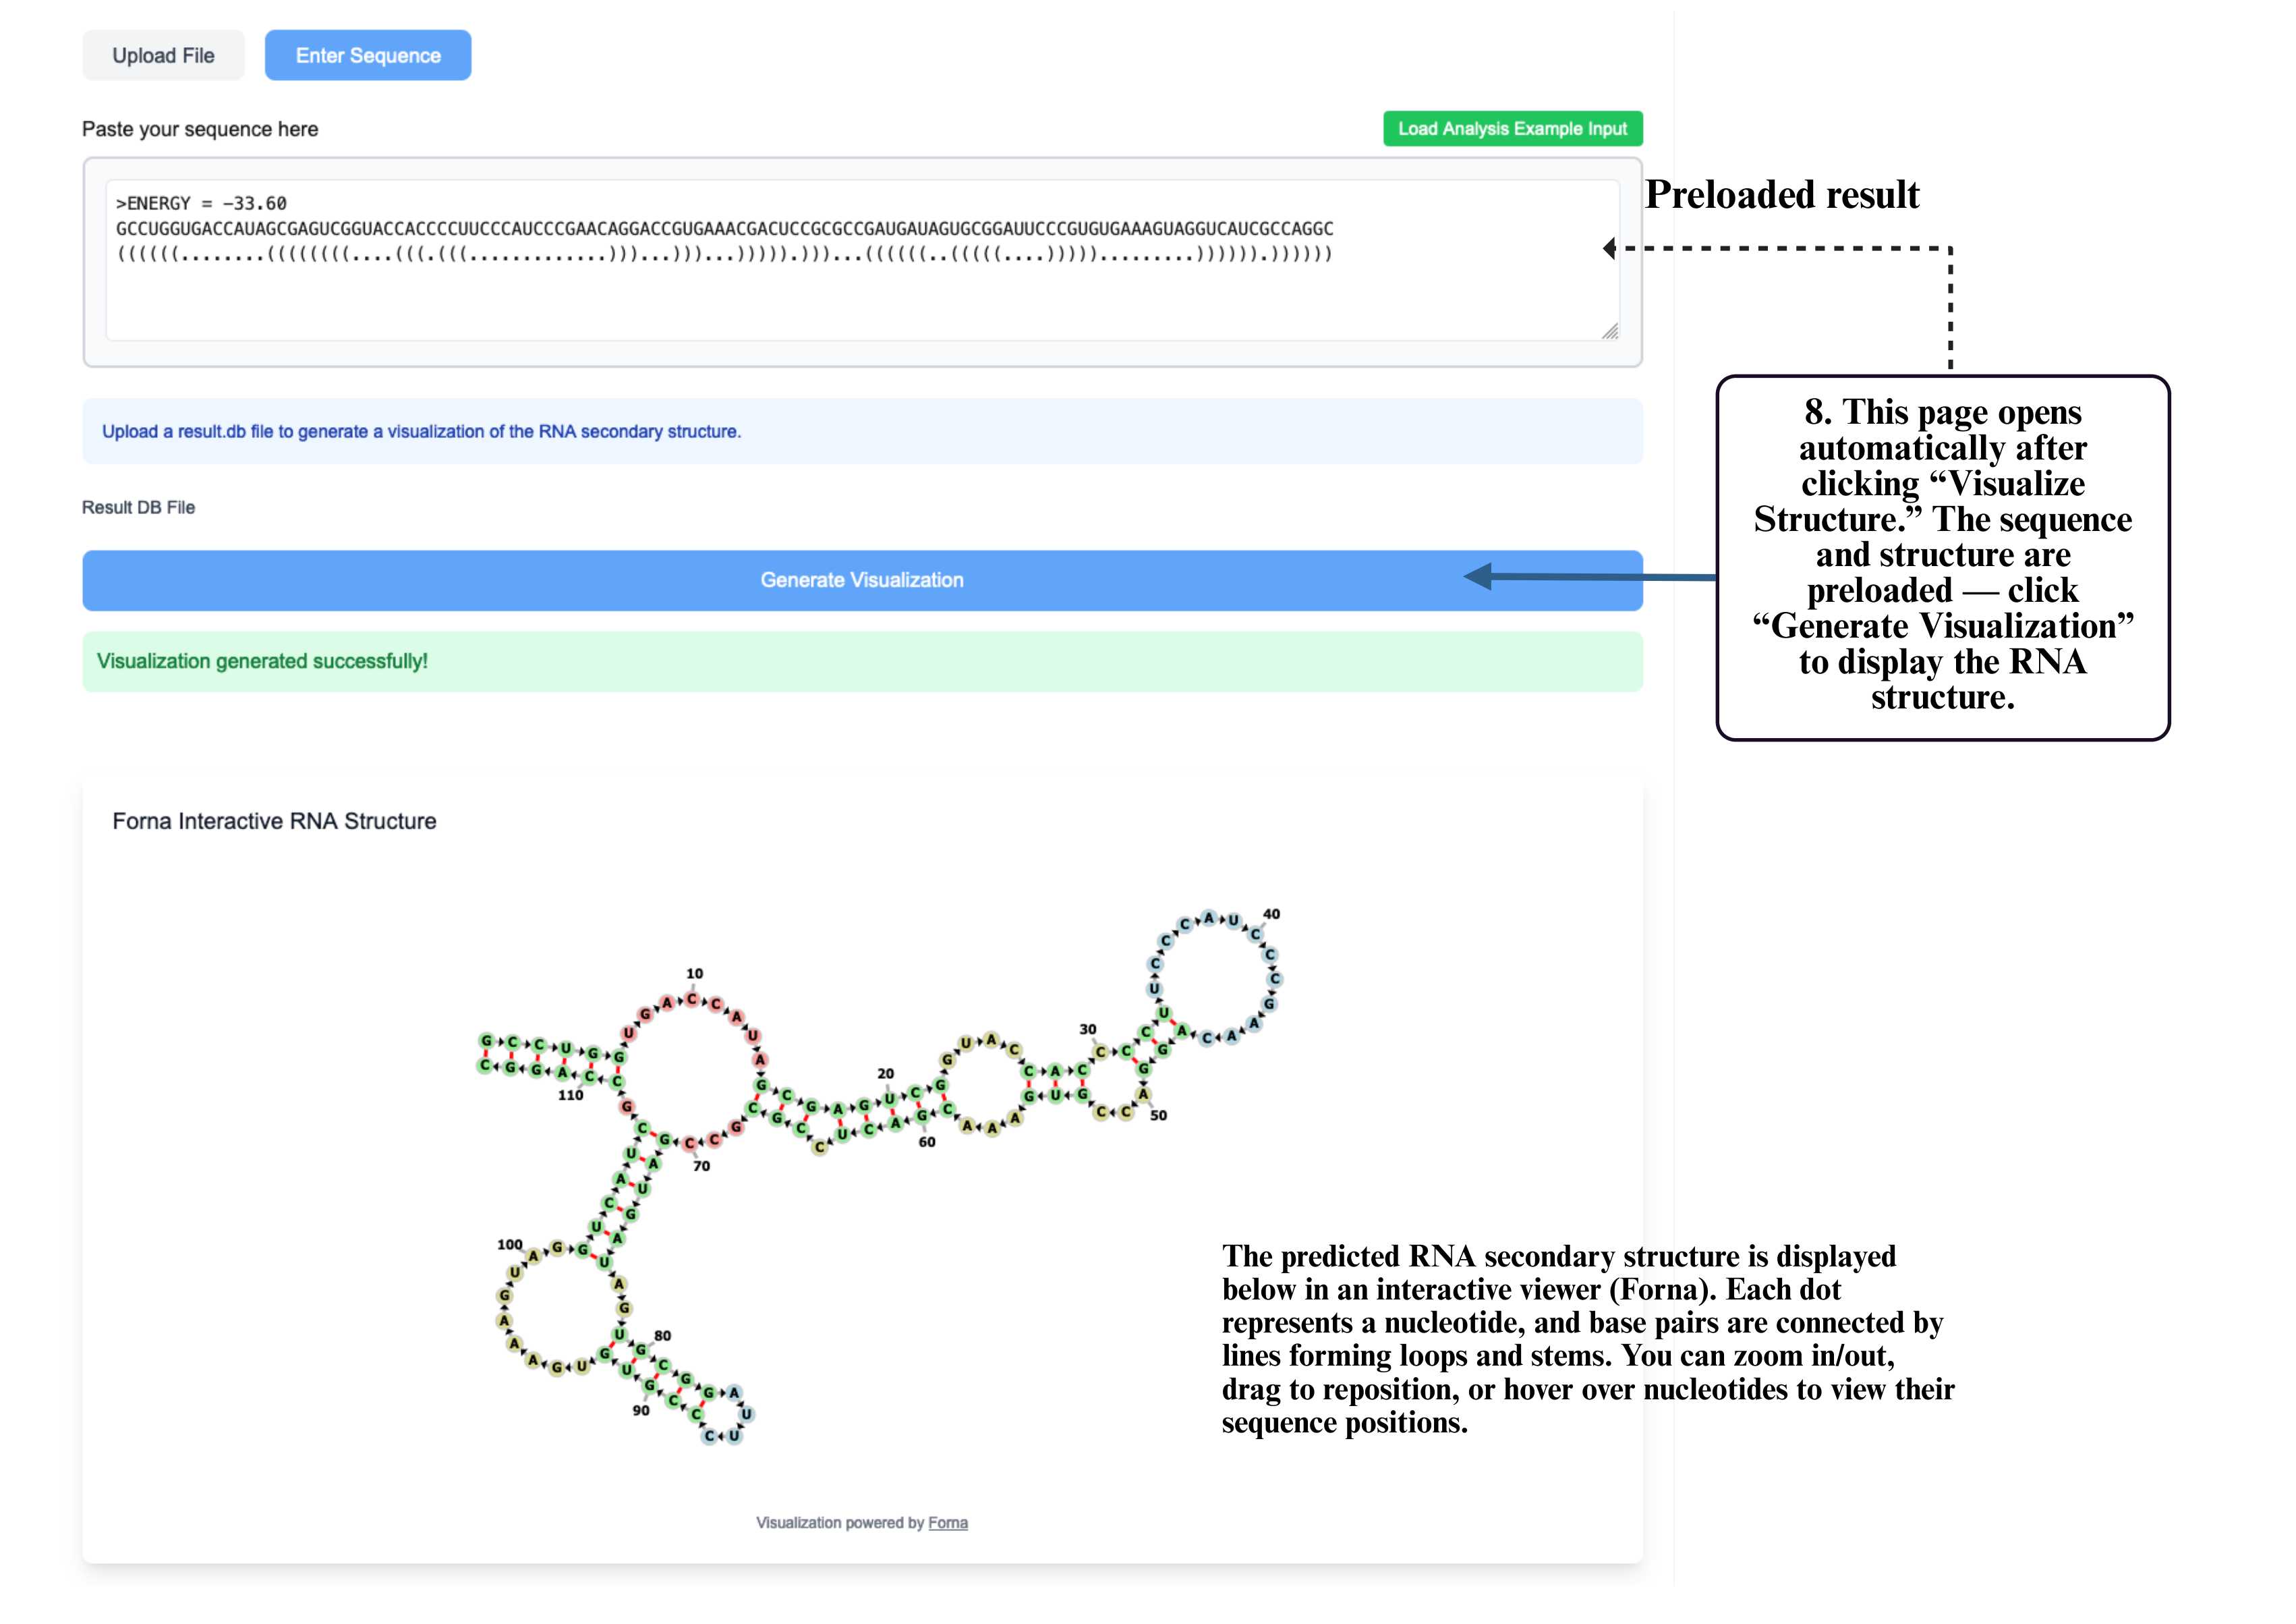
Step 8: On the visualization page, your sequence and structure will be automatically loaded into the input box. Click Generate Visualization to produce the interactive RNA structure display, where you can zoom, drag, and explore detailed folding patterns.
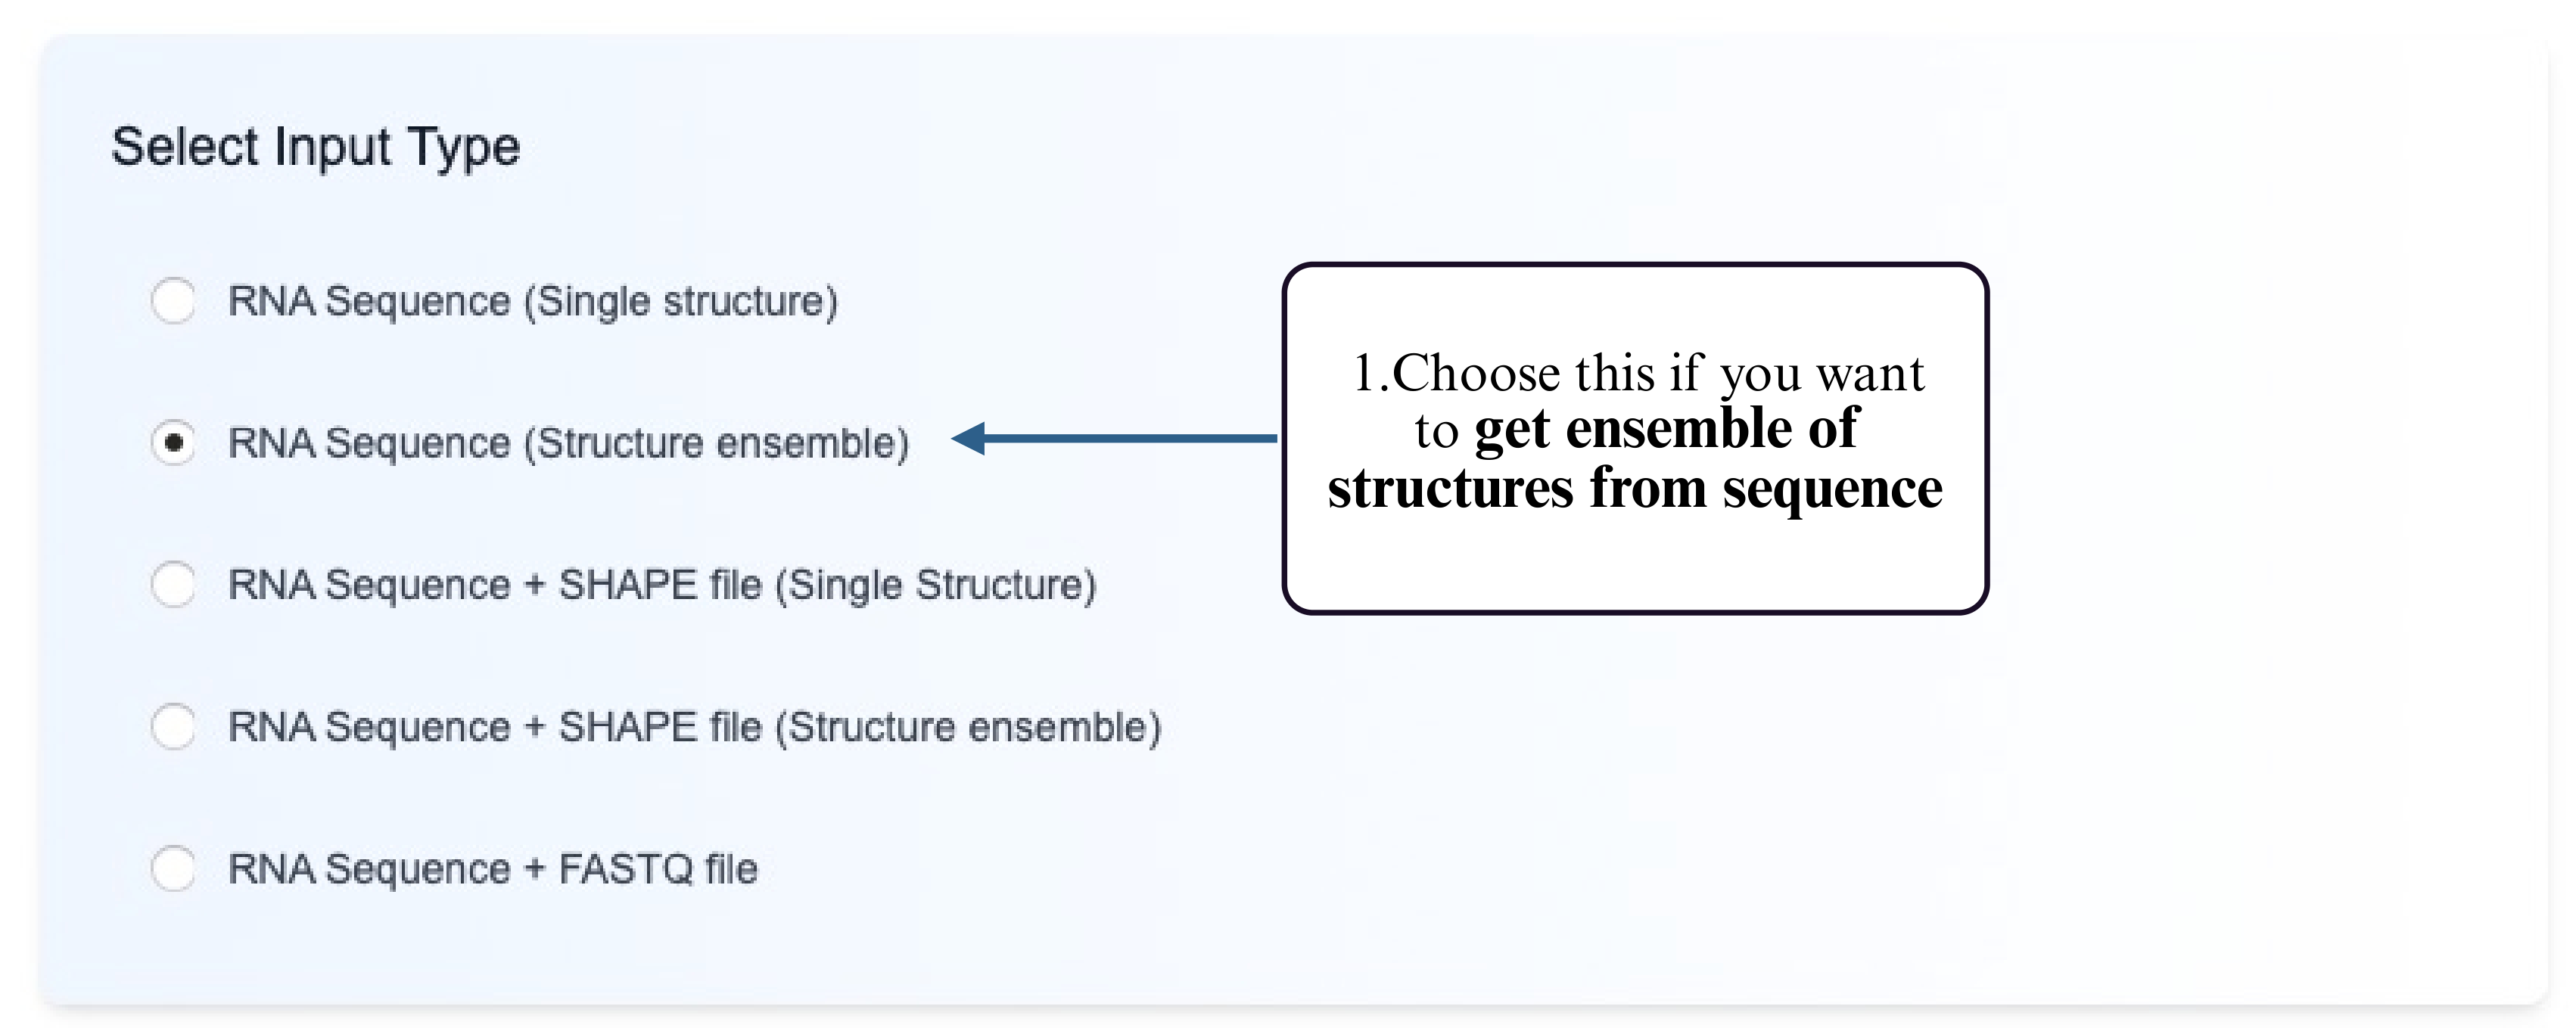
Structure Ensemble Prediction
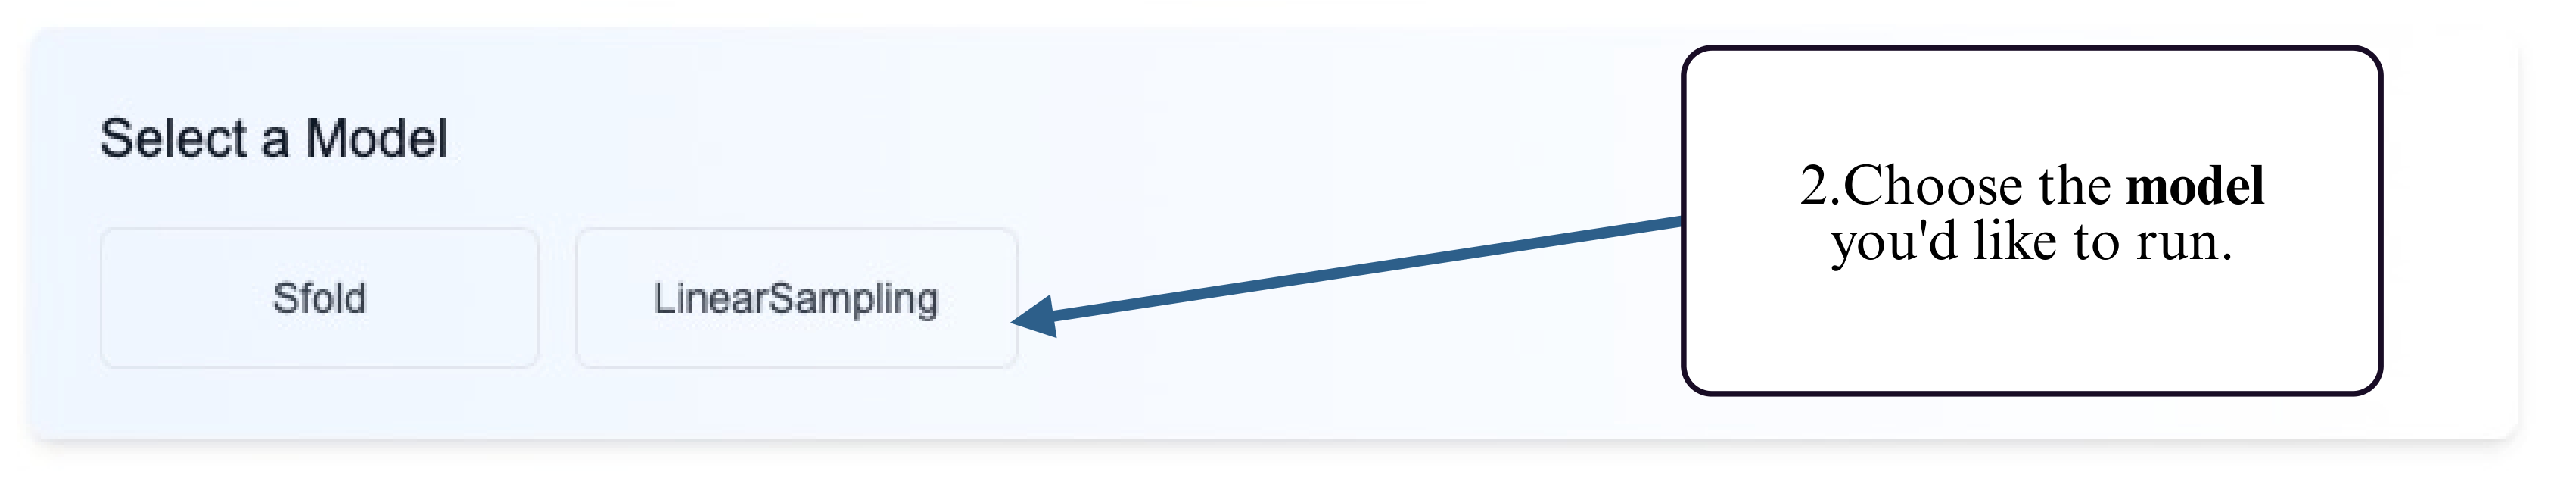
This tool predicts the full ensemble of RNA secondary structures from a plain sequence input. It is suitable when you want to explore the diversity of possible foldings and assess structural uncertainty using base-pairing probabilities or partition function methods, without relying on experimental constraints.
Step 1: Choose the Structure Ensemble option for RNA sequence input.
Step 2: Select the prediction model you would like to run (e.g., partition function–based or probabilistic ensemble models).
Step 3: Choose your preferred input method — upload a FASTA file or type/paste your RNA sequence into the input box.
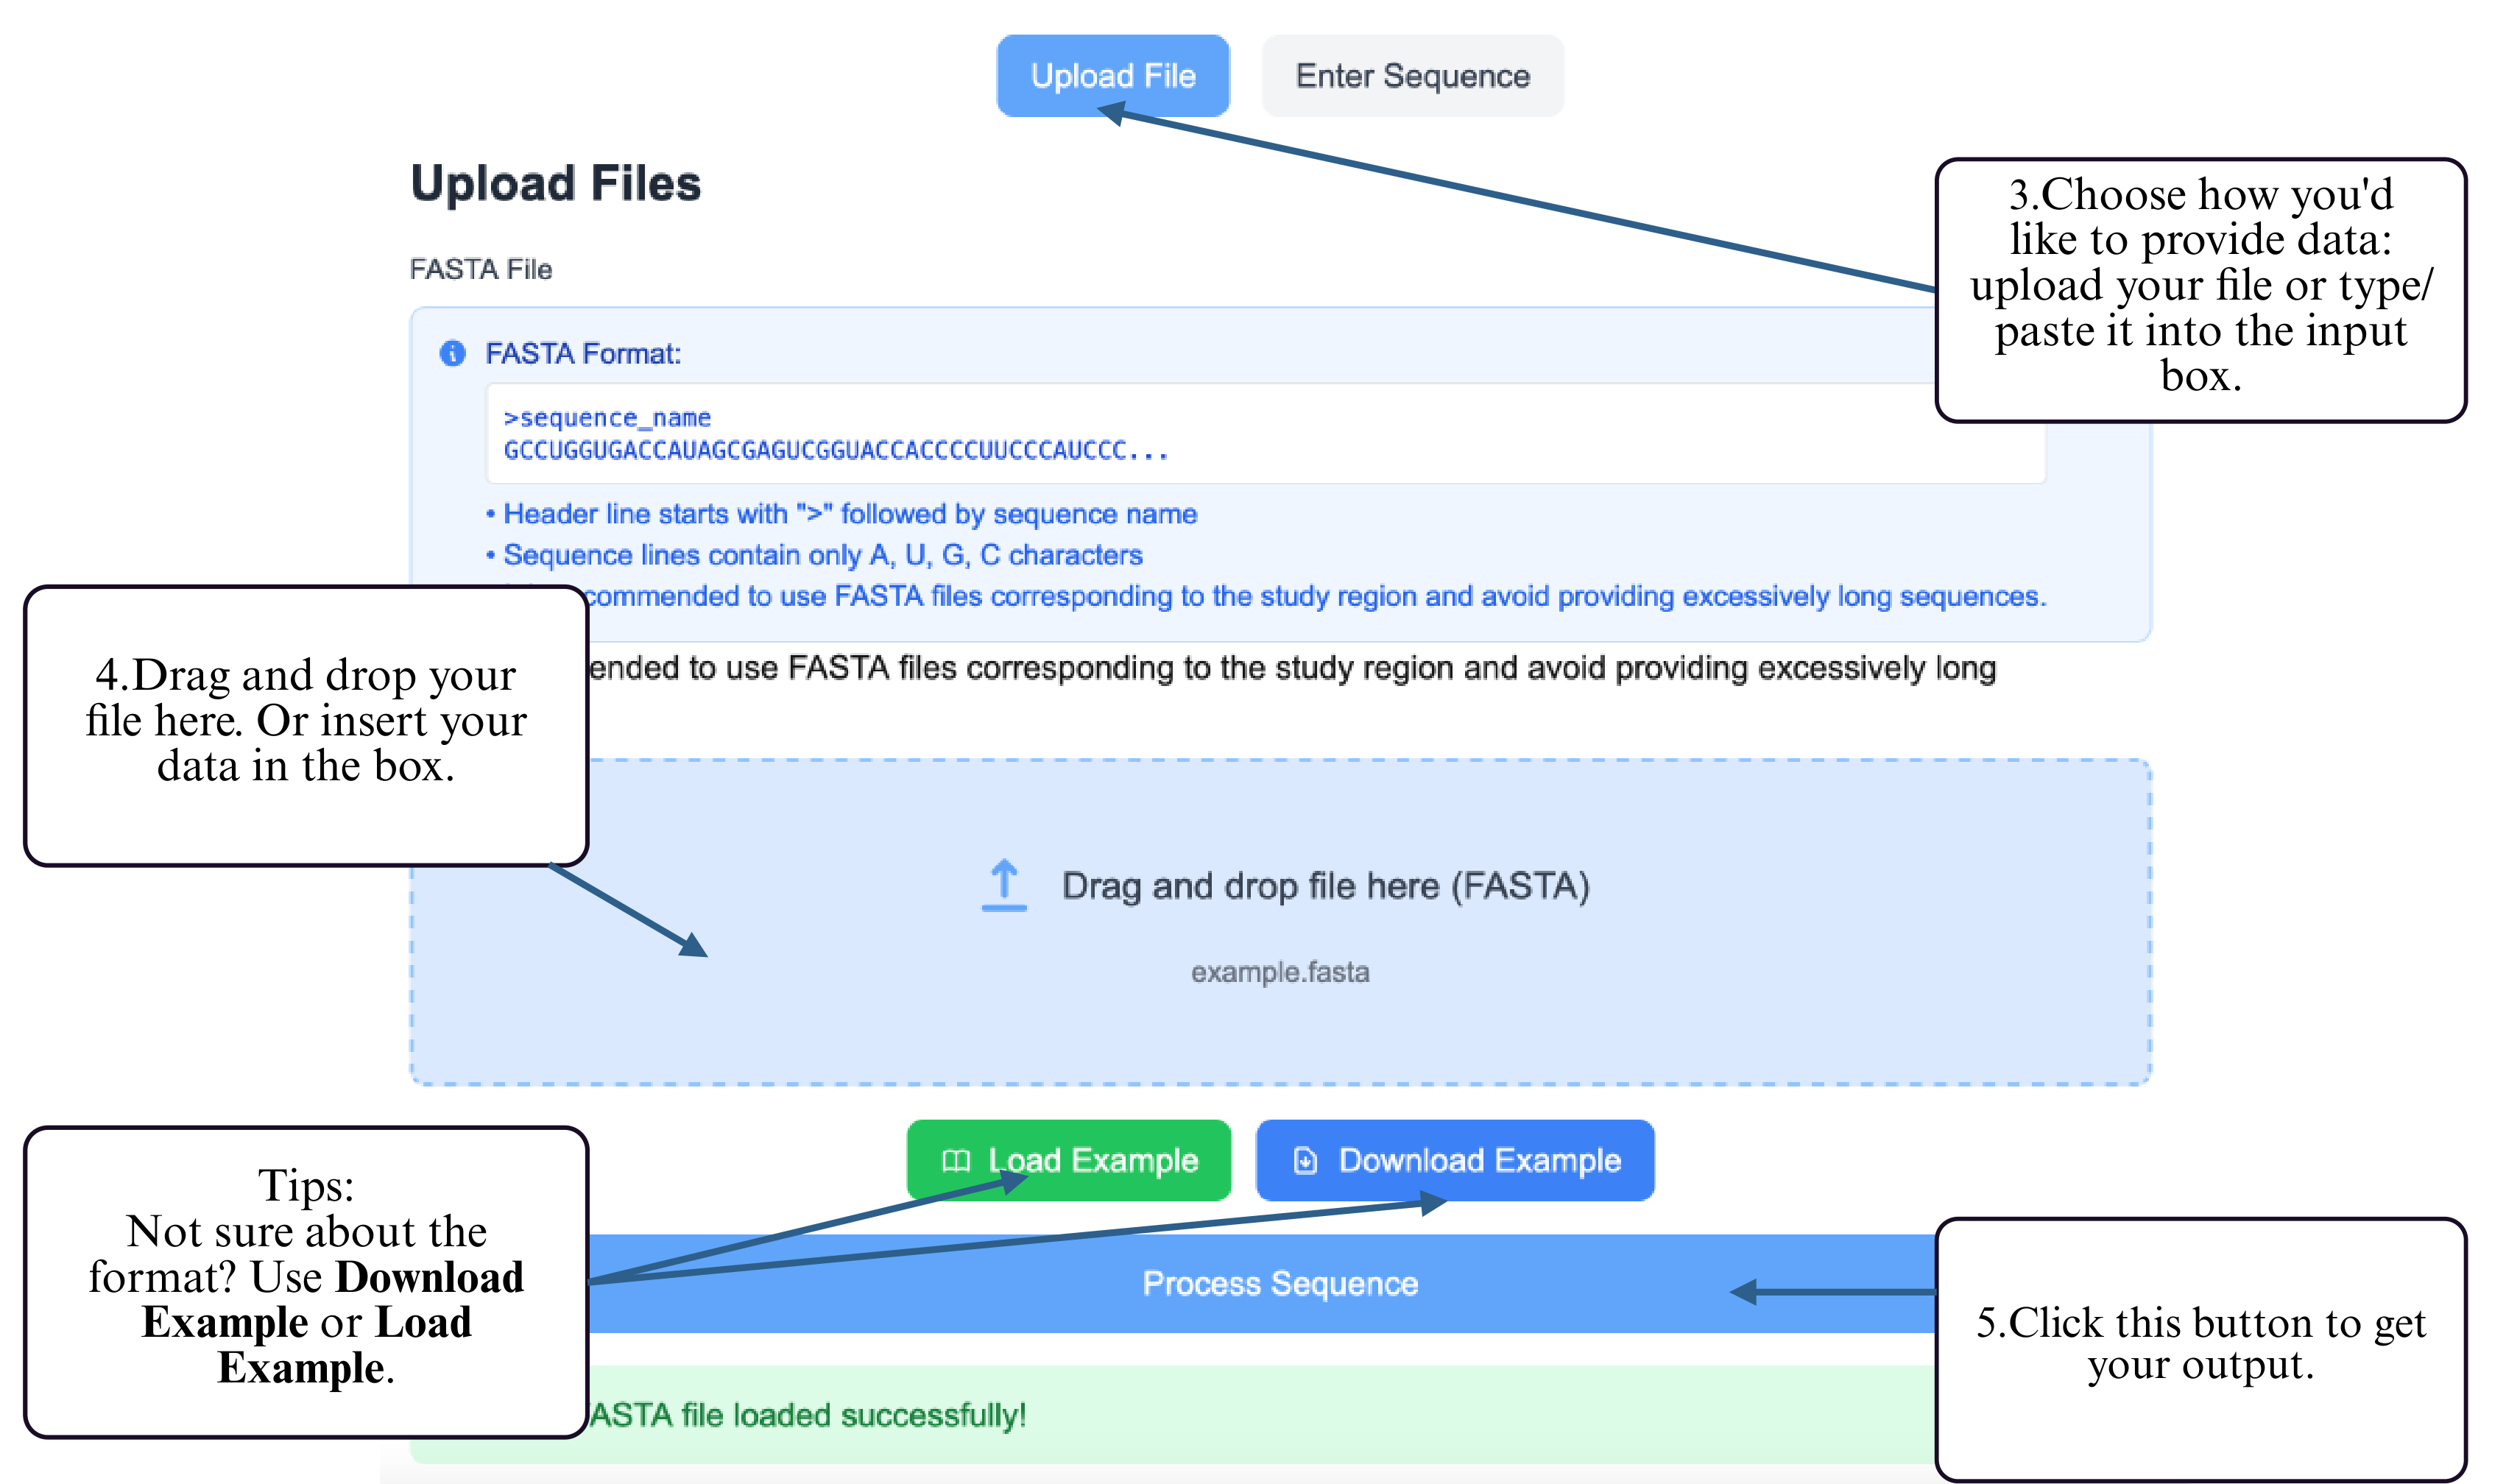
Step 4: Provide your RNA sequence — either by uploading a FASTA file or by typing/pasting the sequence into the input box.
Step 5: Click the Submit button to start the prediction.
Step 6: Once completed, click the download button to obtain your ensemble prediction results.
(Optional) Use Clear Cache to reset the page before starting a new task.
Step 7: You can also click Visualize Structure to open the interactive visualization tool and inspect your predicted RNA structure directly in the browser.
Step 8: On the visualization page, your sequence and structure will be automatically loaded into the input box. Click Generate Visualization to produce the interactive RNA structure display, where you can zoom, drag, and explore detailed folding patterns.
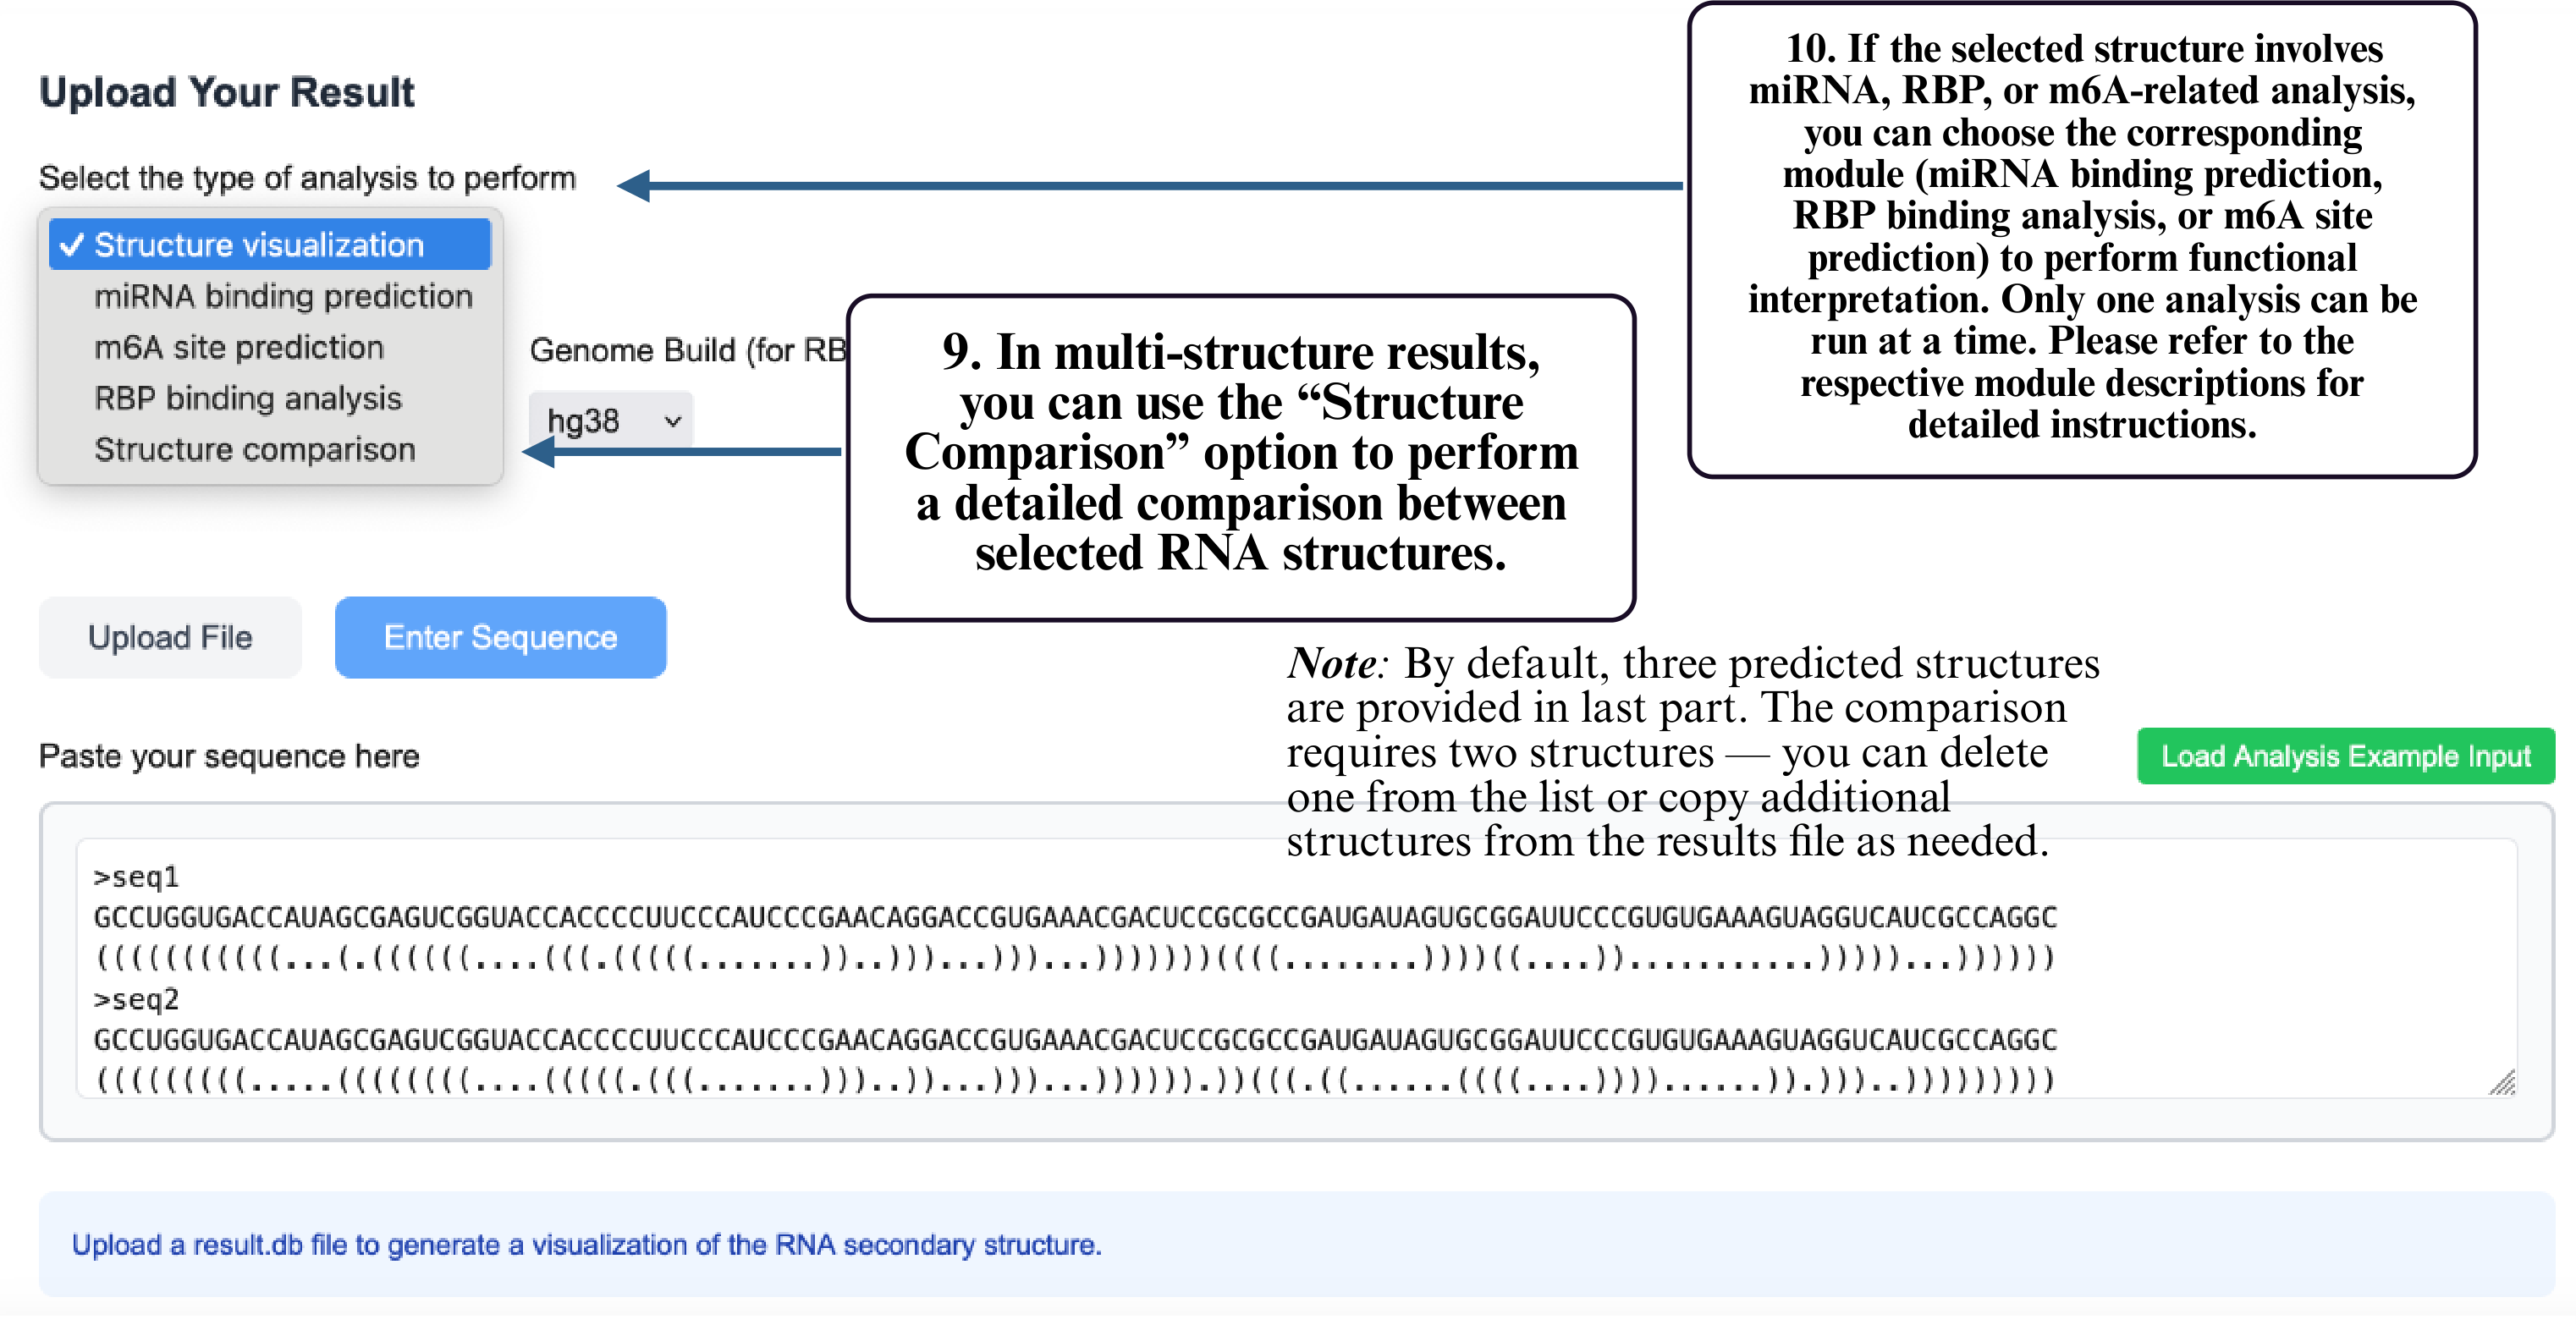
Step 9: In multi-structure results, select Structure Comparison to compare different RNA structural conformations.
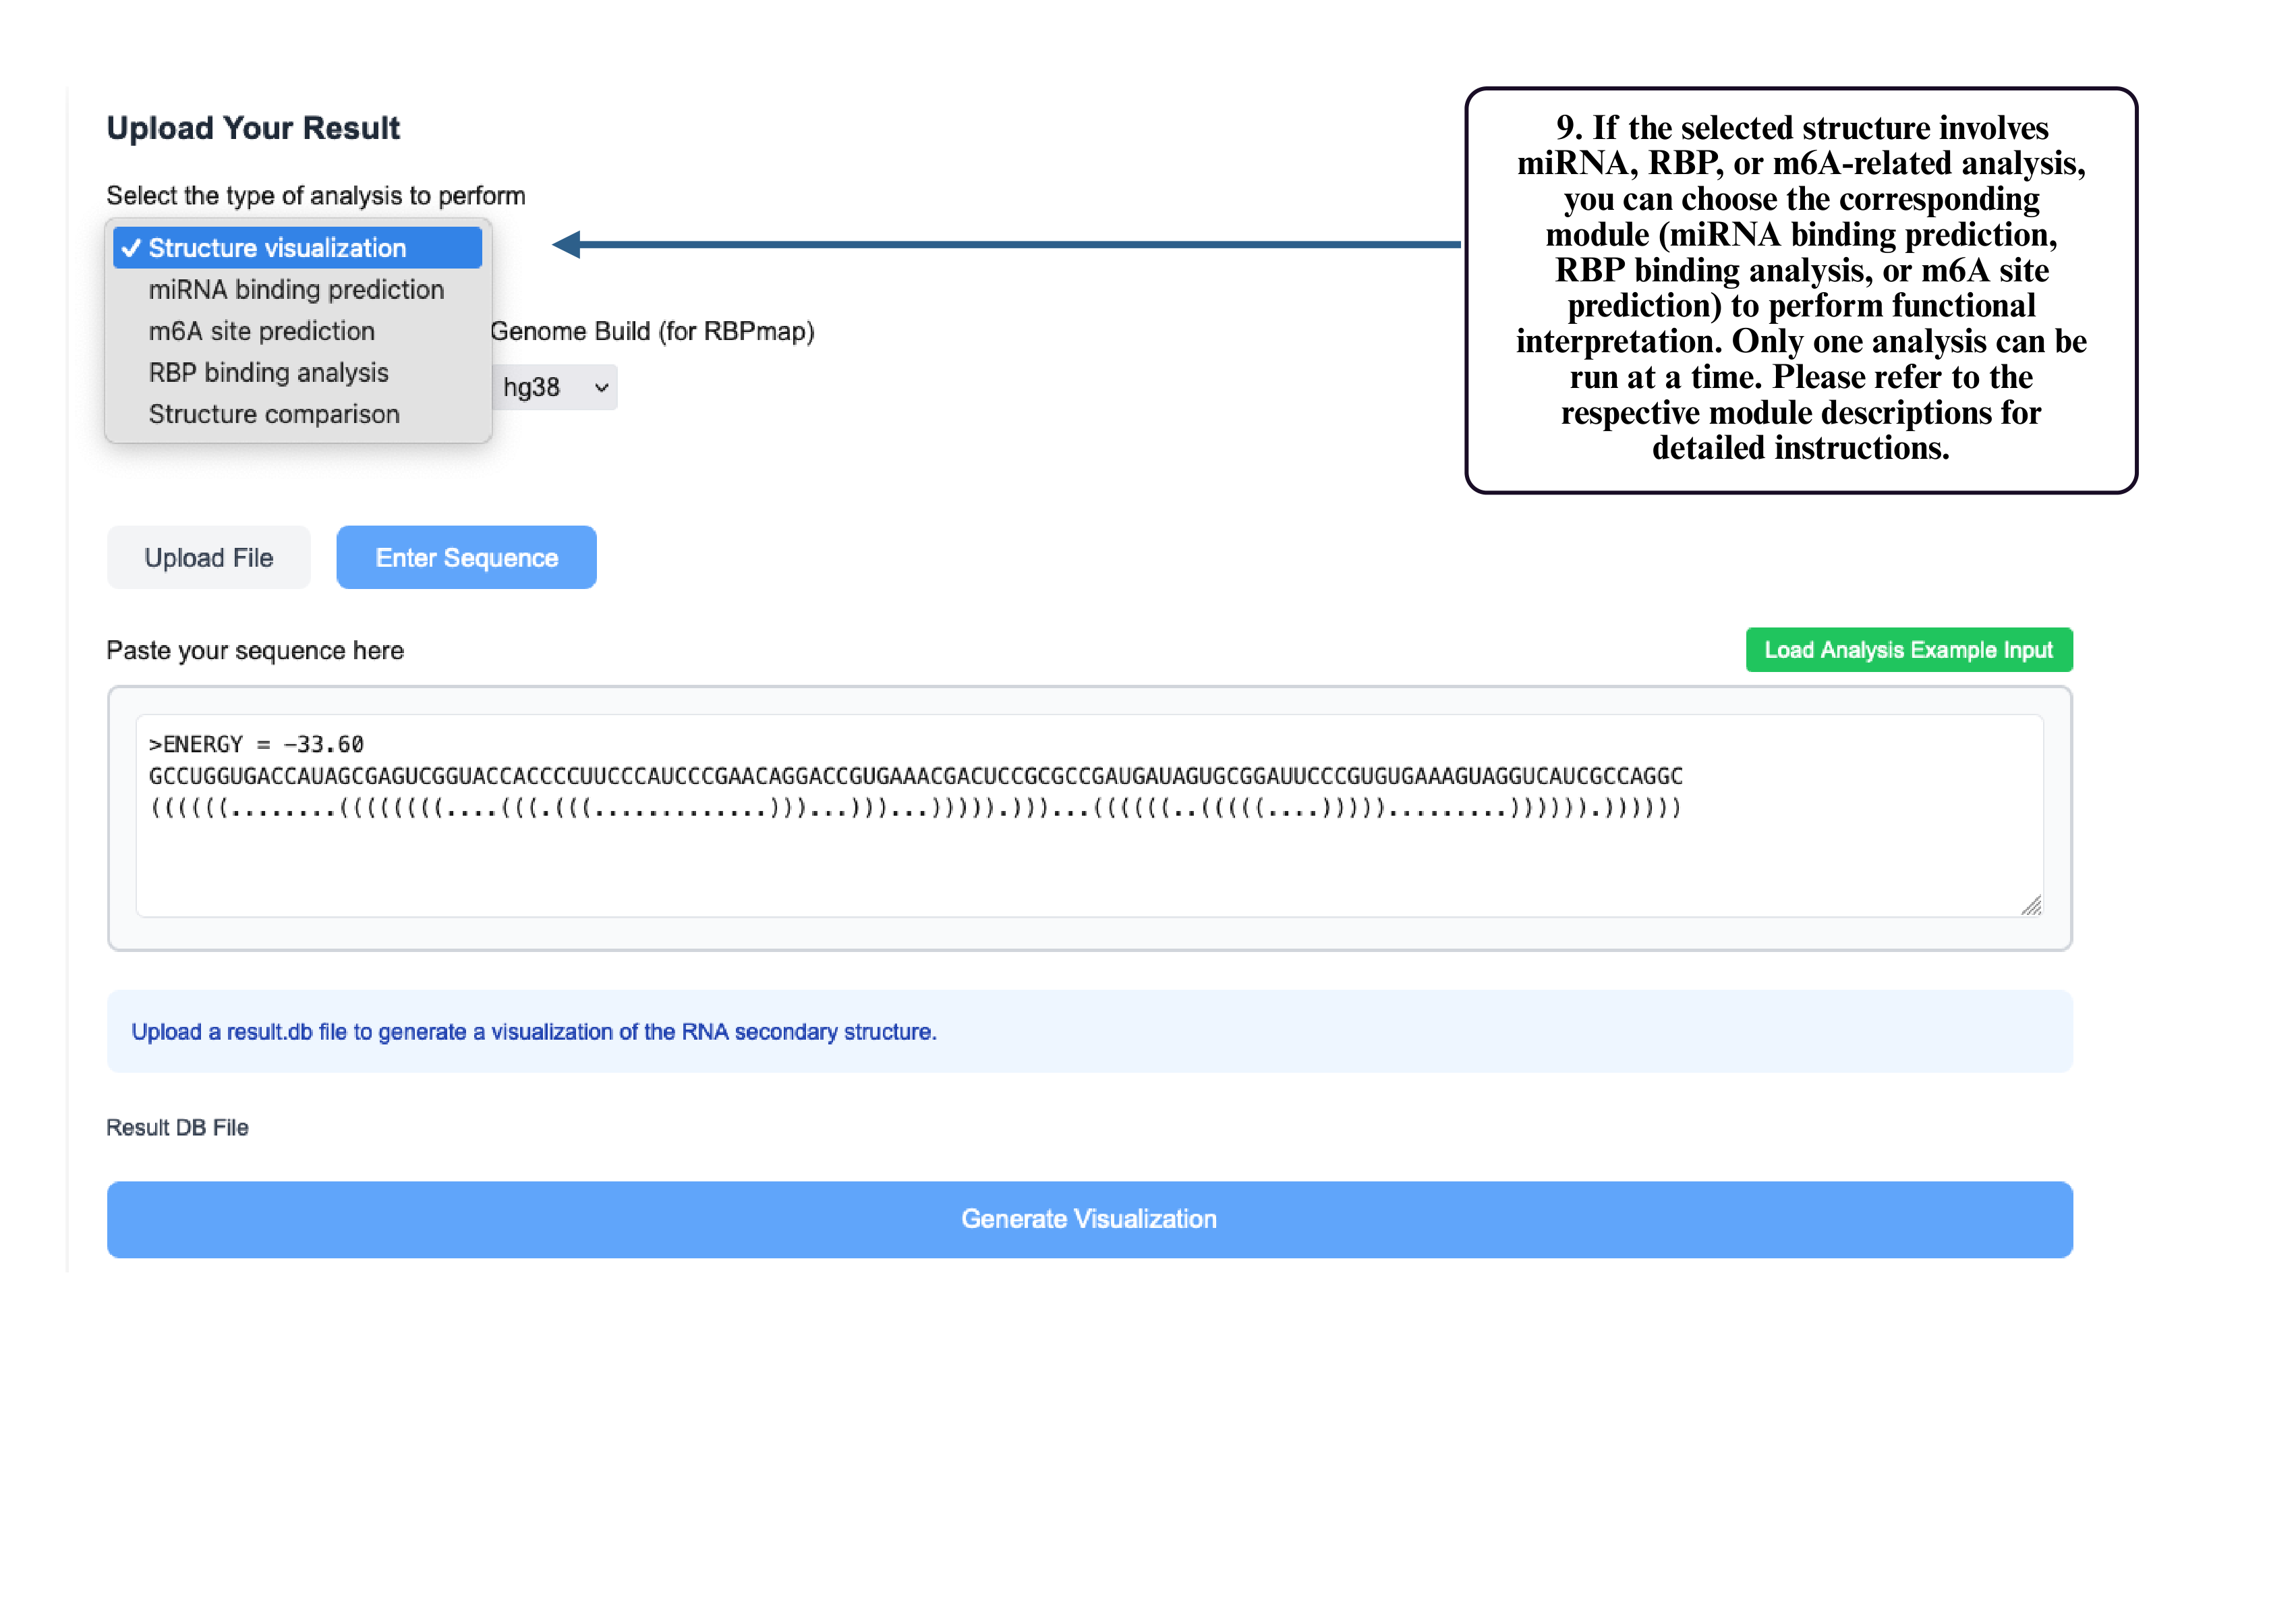
Step 10: If your structure involves miRNA, RBP, or m6A analysis, select the corresponding module to run functional prediction. Only one module can be used at a time.
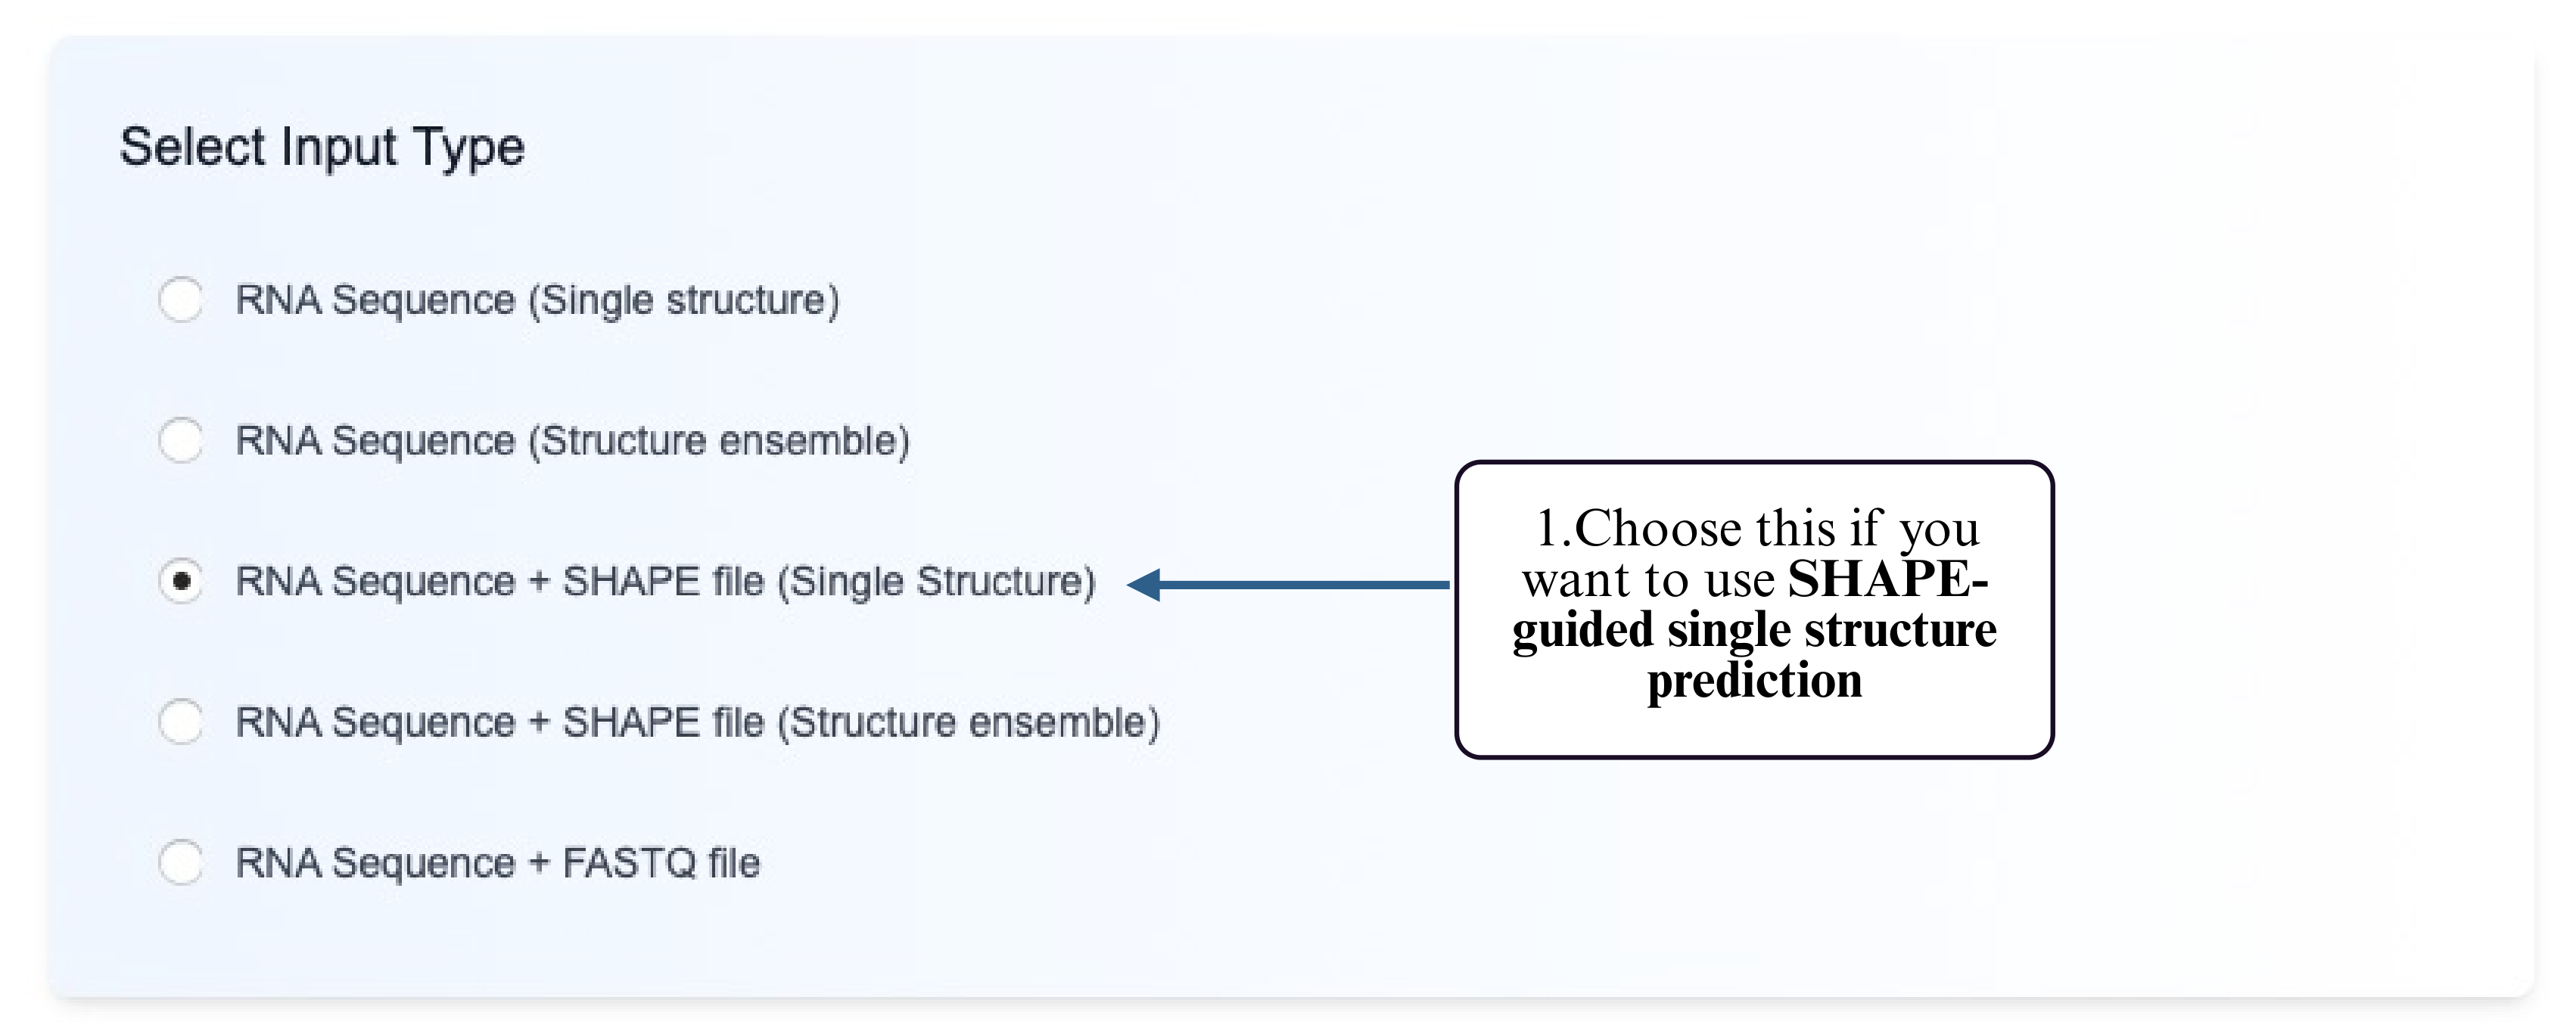
Reactivity-Guided Single Structure Prediction
This mode allows you to predict a single RNA secondary structure using both sequence and SHAPE/DMS reactivity data. SHAPE/DMS (Selective 2′-Hydroxyl Acylation analyzed by Primer Extension) reactivity data provide experimental constraints that improve the accuracy of structure prediction by guiding the folding process toward biologically relevant conformations.
Step 1: Choose the Reactivity-guided Single Structure option.
Step 2: Select a supported prediction model that accepts reactivity input.
Step 3: Choose your preferred input method — upload a FASTA file or type/paste your RNA sequence into the input box.
Step 4: Drag and drop both files into the upload area or paste their contents directly.
Step 5: Click the Submit button to run the prediction.
Step 6: After the job completes, click the download button to retrieve your predicted structure.
(Optional) Use Clear Cache to remove the current results and begin a new task.
Step 7: You can also click Visualize Structure to open the interactive visualization tool and inspect your predicted RNA structure directly in the browser.
Step 8: On the visualization page, your sequence and structure will be automatically loaded into the input box. Click Generate Visualization to produce the interactive RNA structure display, where you can zoom, drag, and explore detailed folding patterns.
Step 9: If your structure involves miRNA, RBP, or m6A analysis, select the corresponding module to run functional prediction. Only one module can be used at a time.
Reactivity-Guided Structure Ensemble Prediction
This mode allows you to generate a structural ensemble of RNA conformations guided by SHAPE/DMS reactivity data. By integrating experimental SHAPE/DMS constraints into partition function calculations, this method provides a diversity of likely structures with improved biological relevance.
Step 1: Choose the RNA Sequence + reactivity-guided Structure Ensemble option.
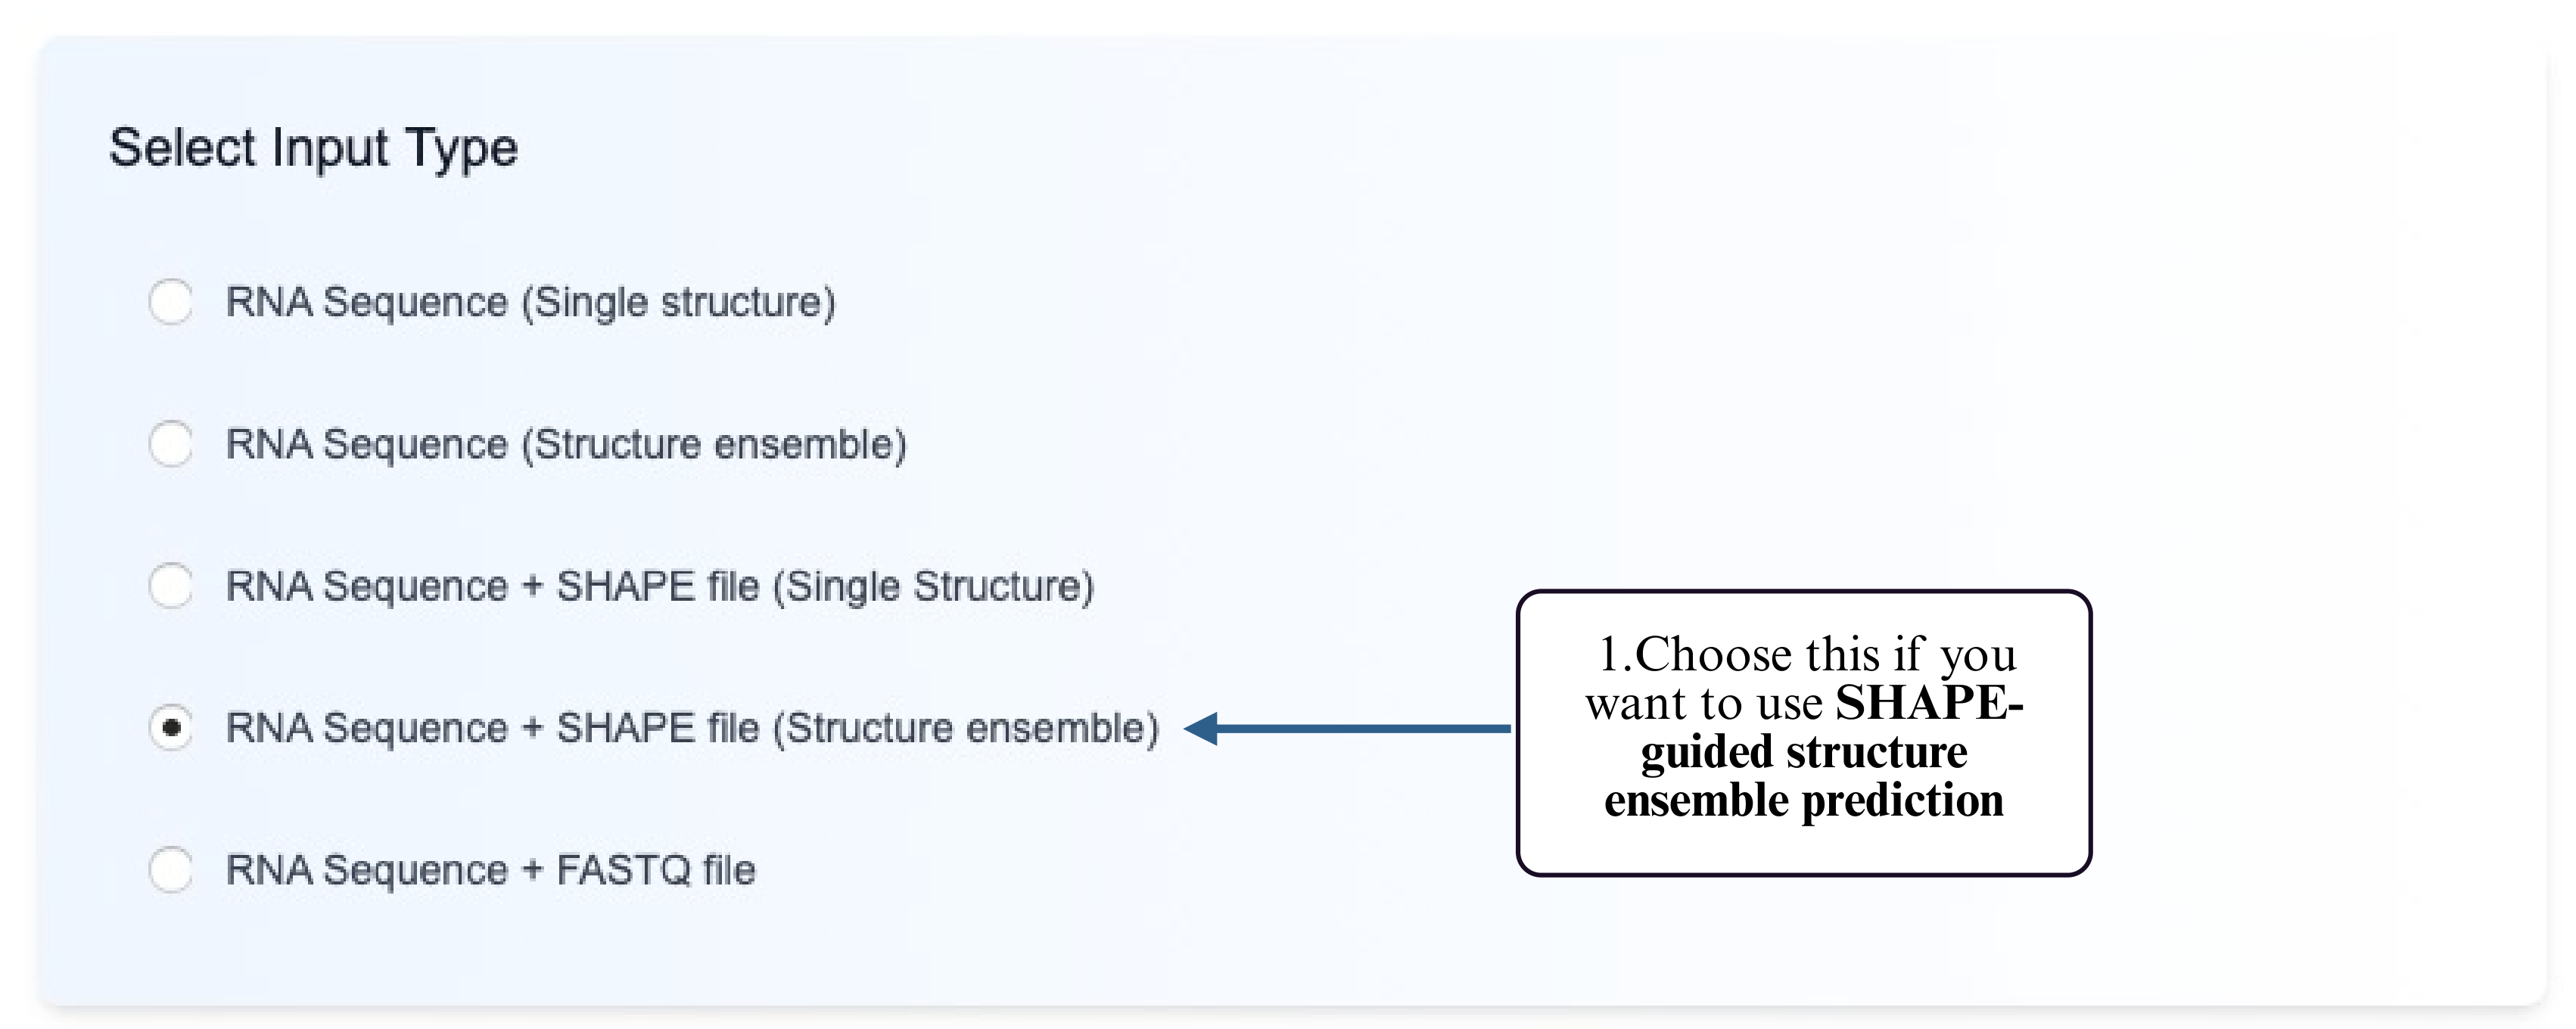
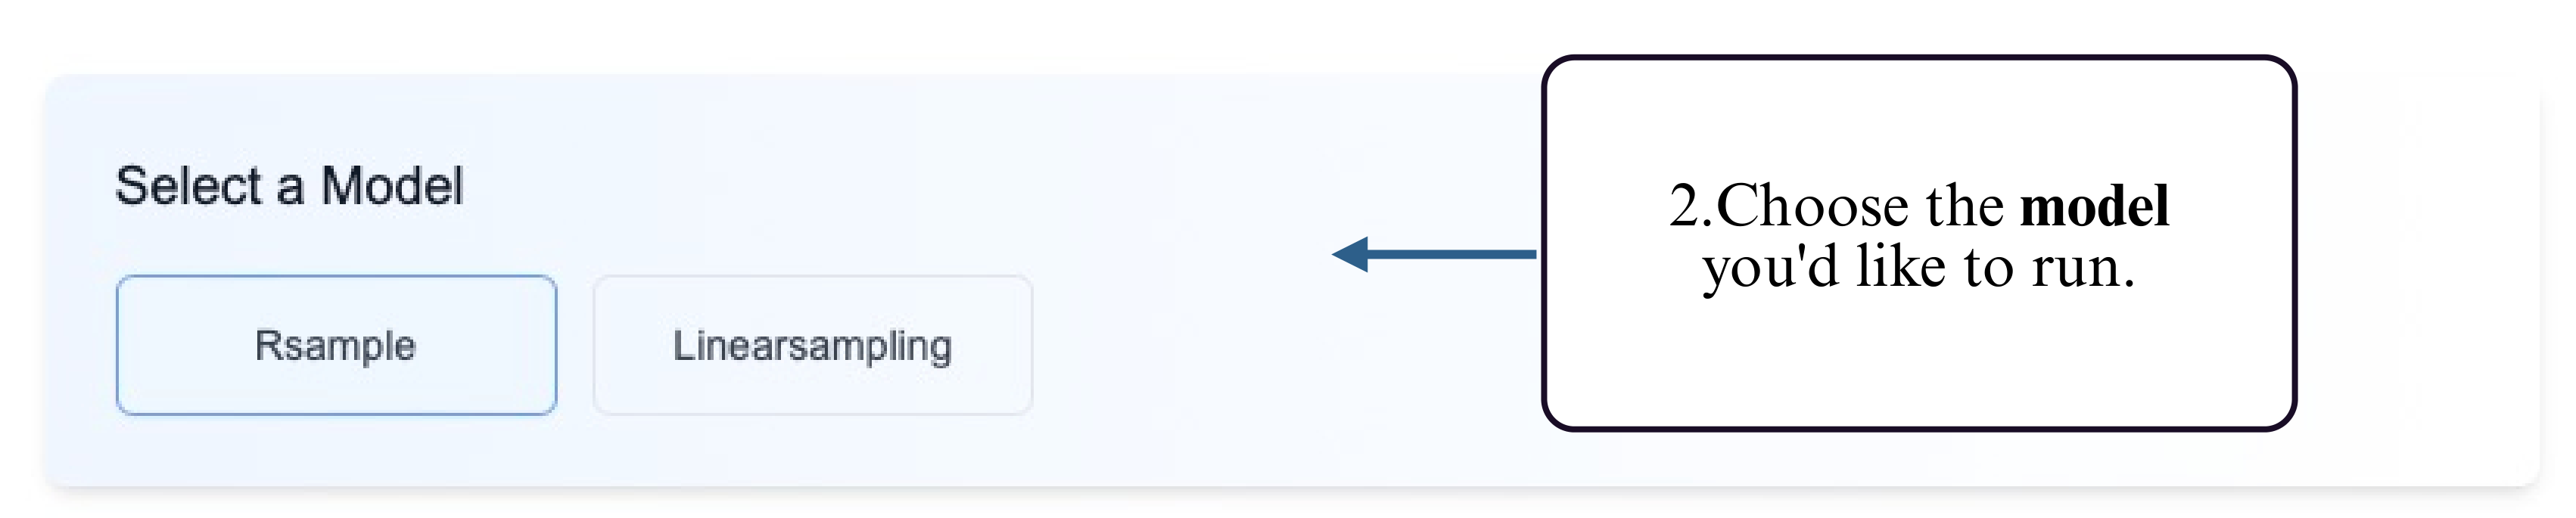
Step 2: Select a model that supports reactivity-constrained ensemble prediction.
Step 3: Choose your preferred input method — upload a FASTA file or type/paste your RNA sequence into the input box.
Step 4: Provide your inputs by uploading both the RNA sequence (FASTA format) and reactivity file (plain text), or paste both into the input box.
Step 5: Click the Submit button to begin the ensemble prediction.

Step 6: After processing, click the download button to retrieve your ensemble results.
(Optional) Use Clear Cache to clear previous results before starting a new analysis.
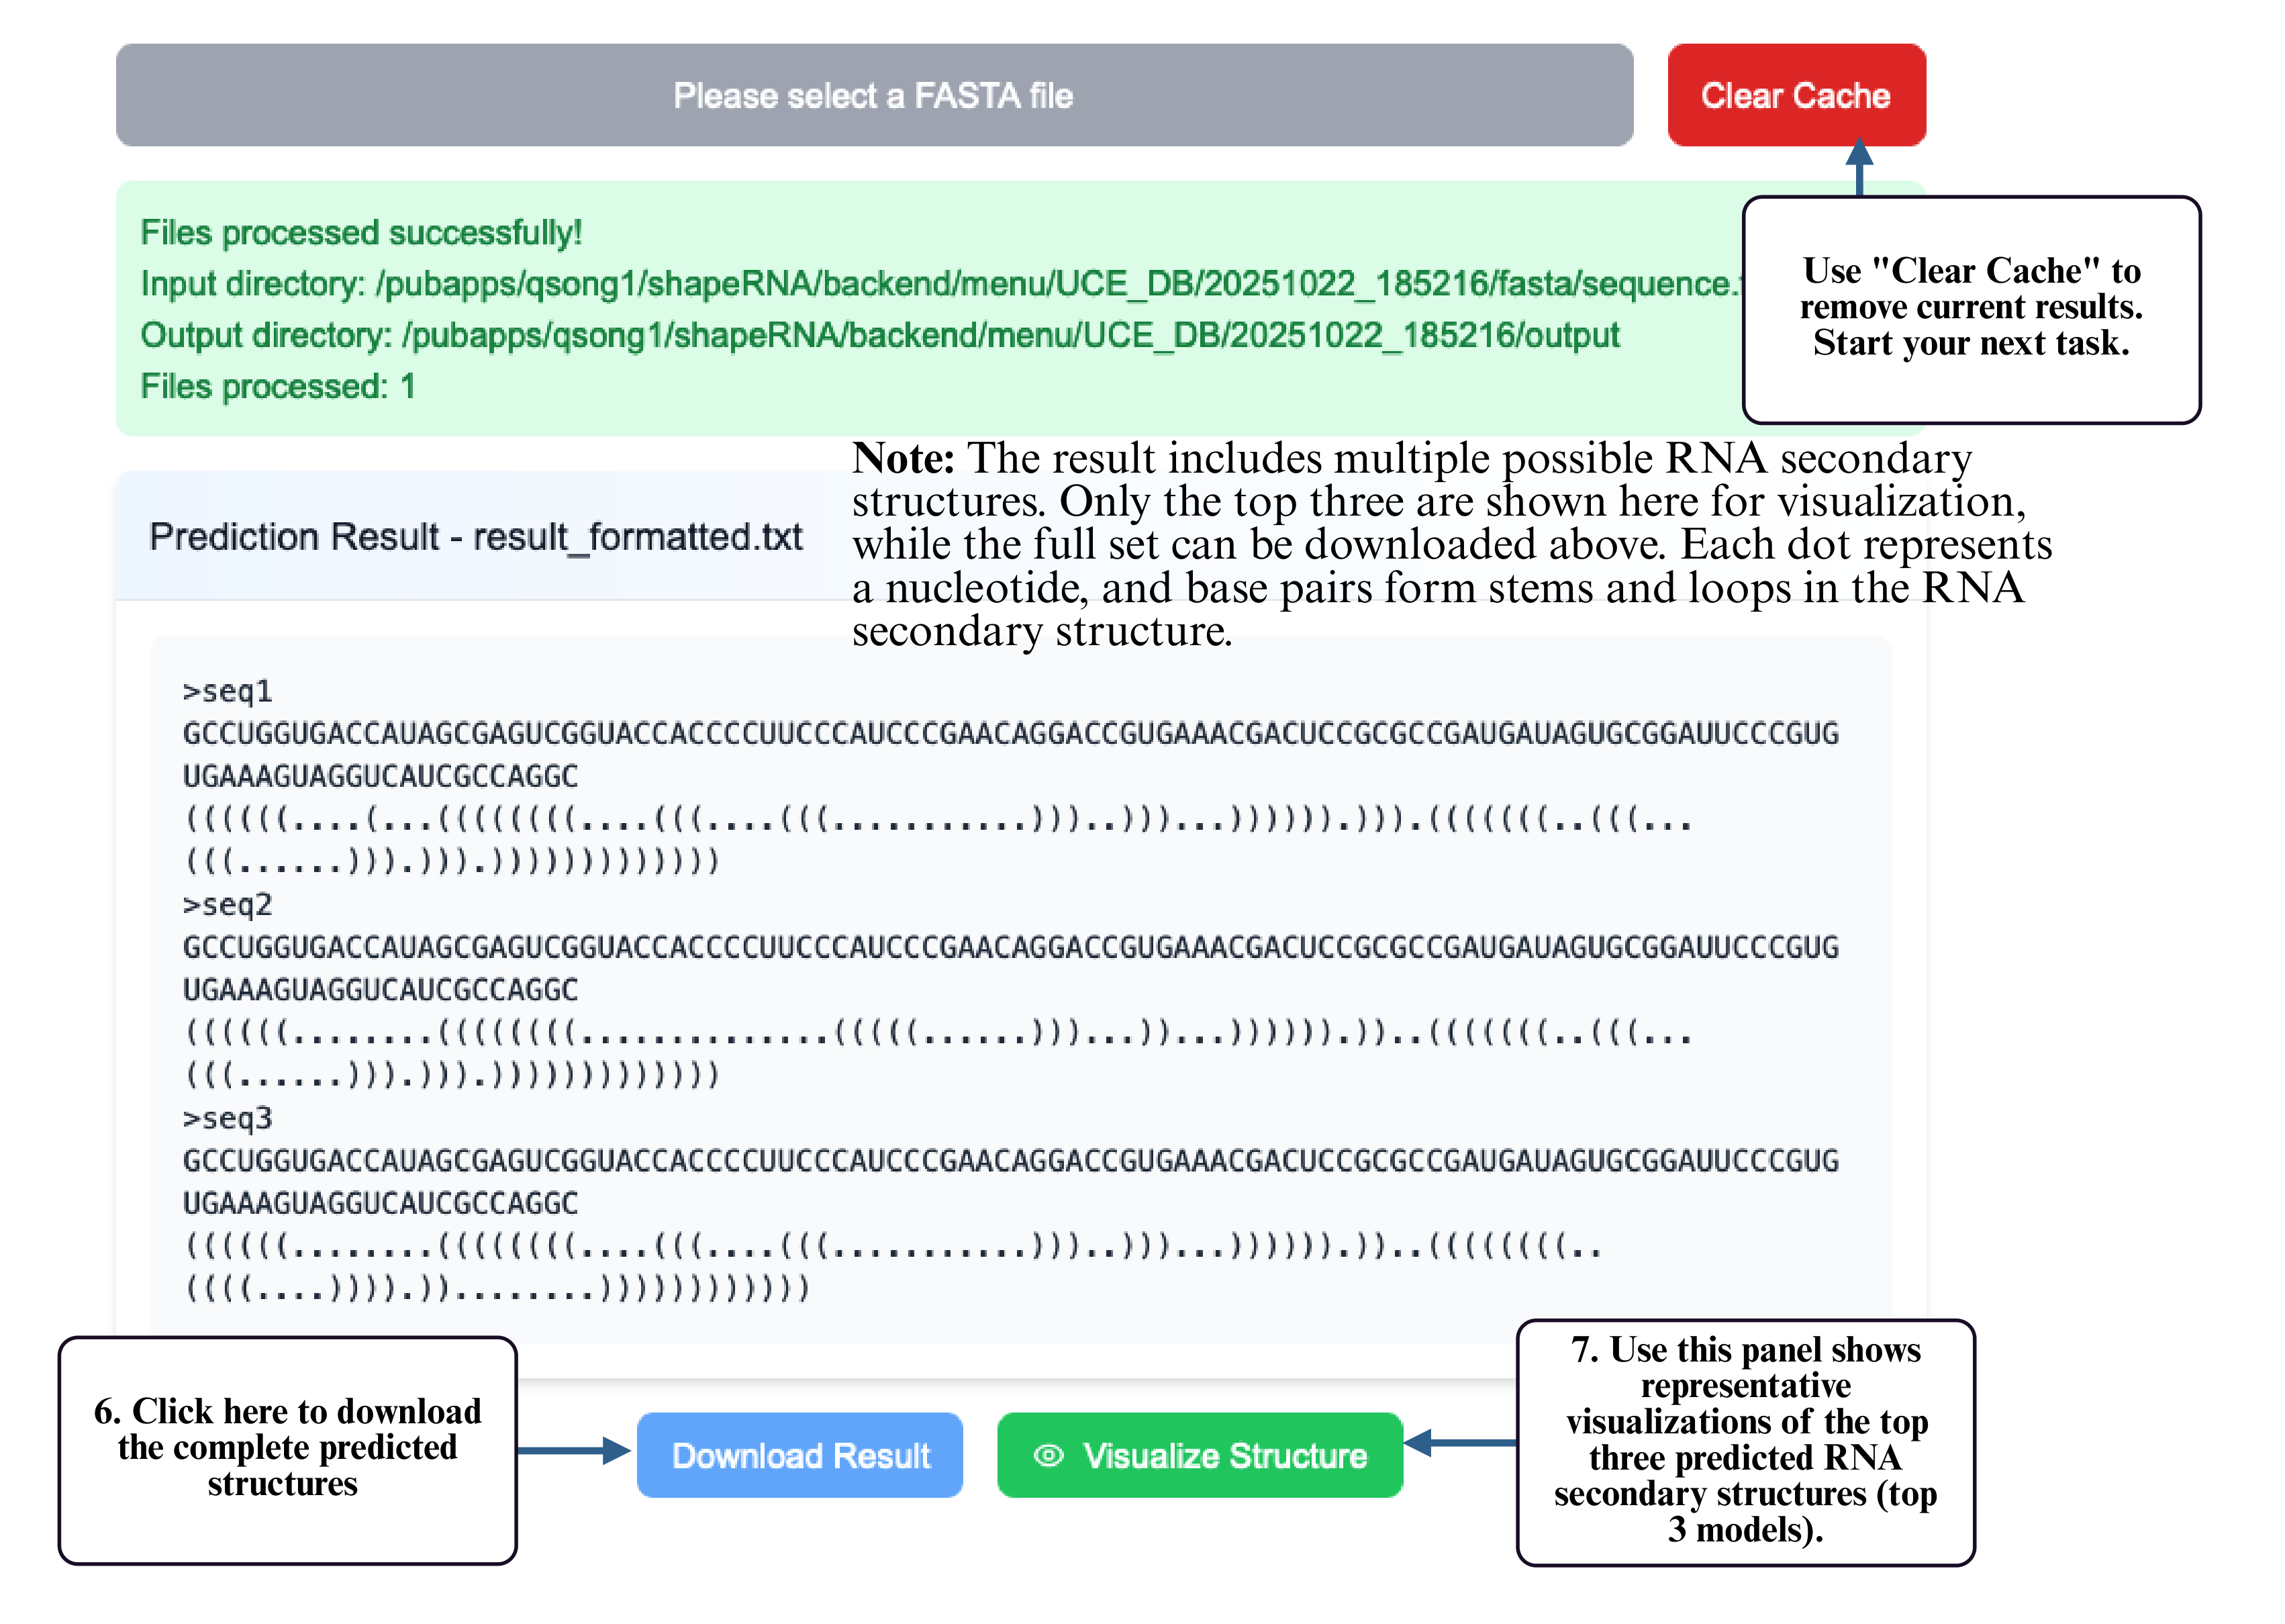
Step 7: You can also click Visualize Structure to open the interactive visualization tool and inspect your predicted RNA structure directly in the browser.
Step 8: On the visualization page, your sequence and structure will be automatically loaded into the input box. Click Generate Visualization to produce the interactive RNA structure display, where you can zoom, drag, and explore detailed folding patterns.

Step 9: In multi-structure results, select Structure Comparison to compare different RNA structural conformations.
Step 10: If your structure involves miRNA, RBP, or m6A analysis, select the corresponding module to run functional prediction. Only one module can be used at a time.
Structure Clustering from FASTQ
This mode is designed for analyzing high-throughput sequencing reads in FASTQ format to identify mutation-driven structural heterogeneity. The tool performs structure prediction for variant-containing reads, clusters the resulting structures into distinct structural classes, and outputs representative secondary structures for each cluster.
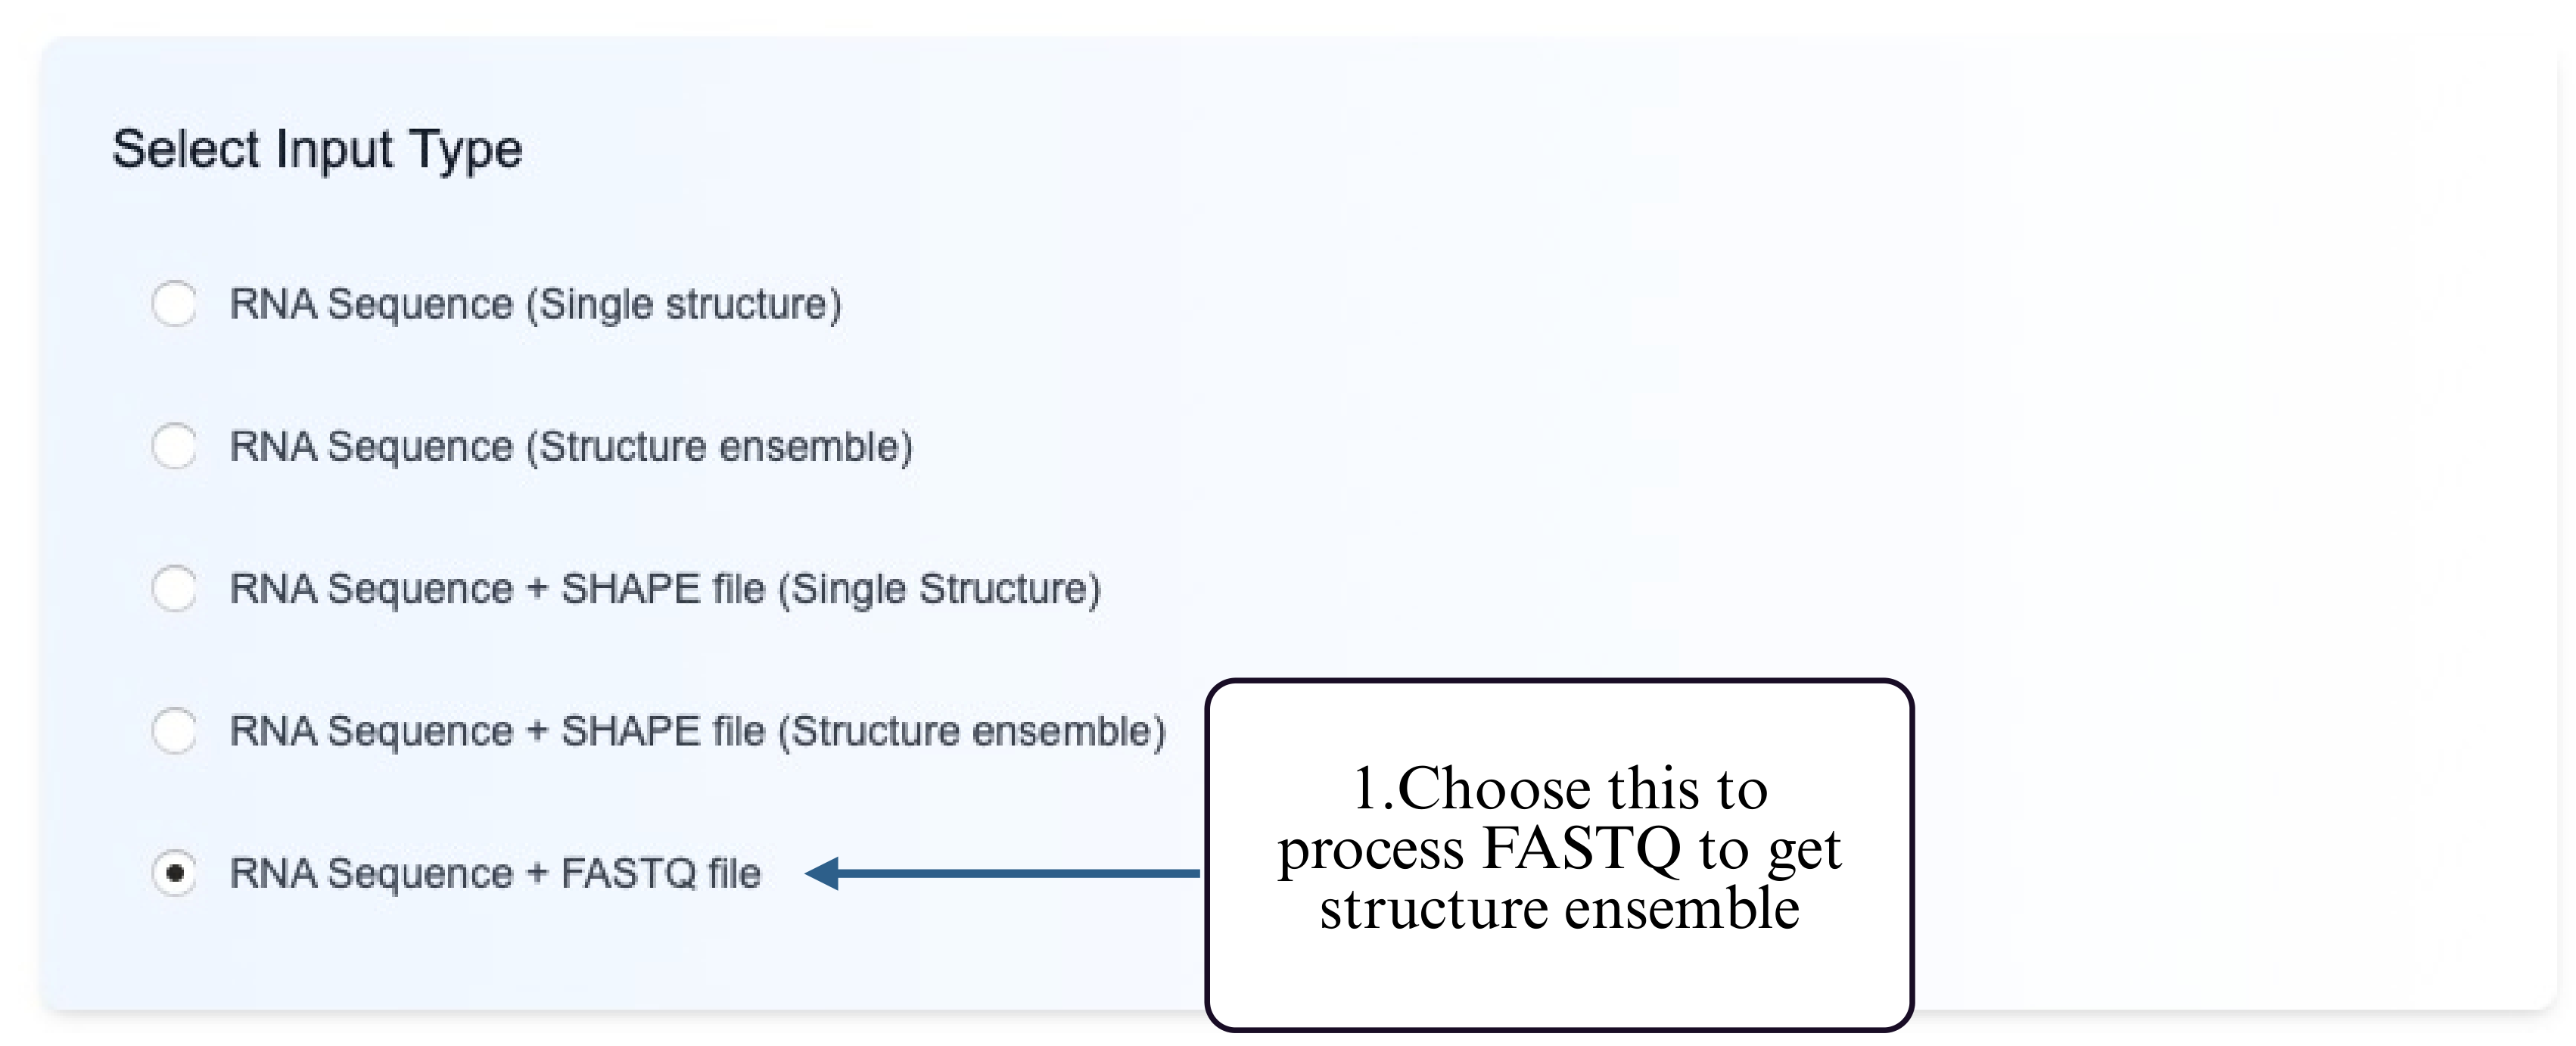
Step 1: Choose the Structure Clustering from FASTQ option.
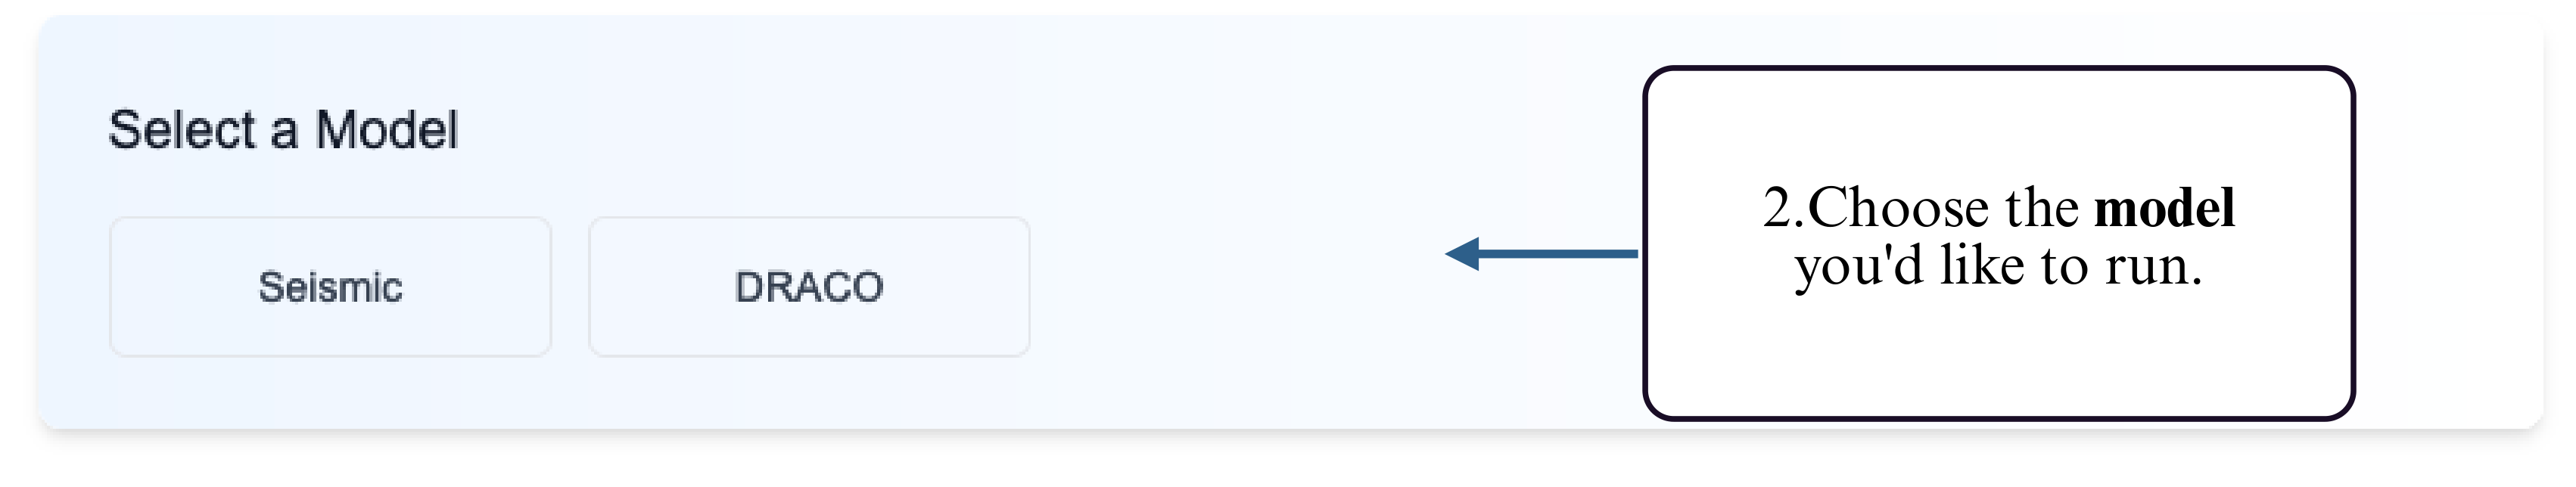
Step 2: Select a supported model for mutation-aware structure prediction.
Step 3: Upload your FASTQ file in the designated input section.
Step 4: Click the Submit button to begin clustering analysis.
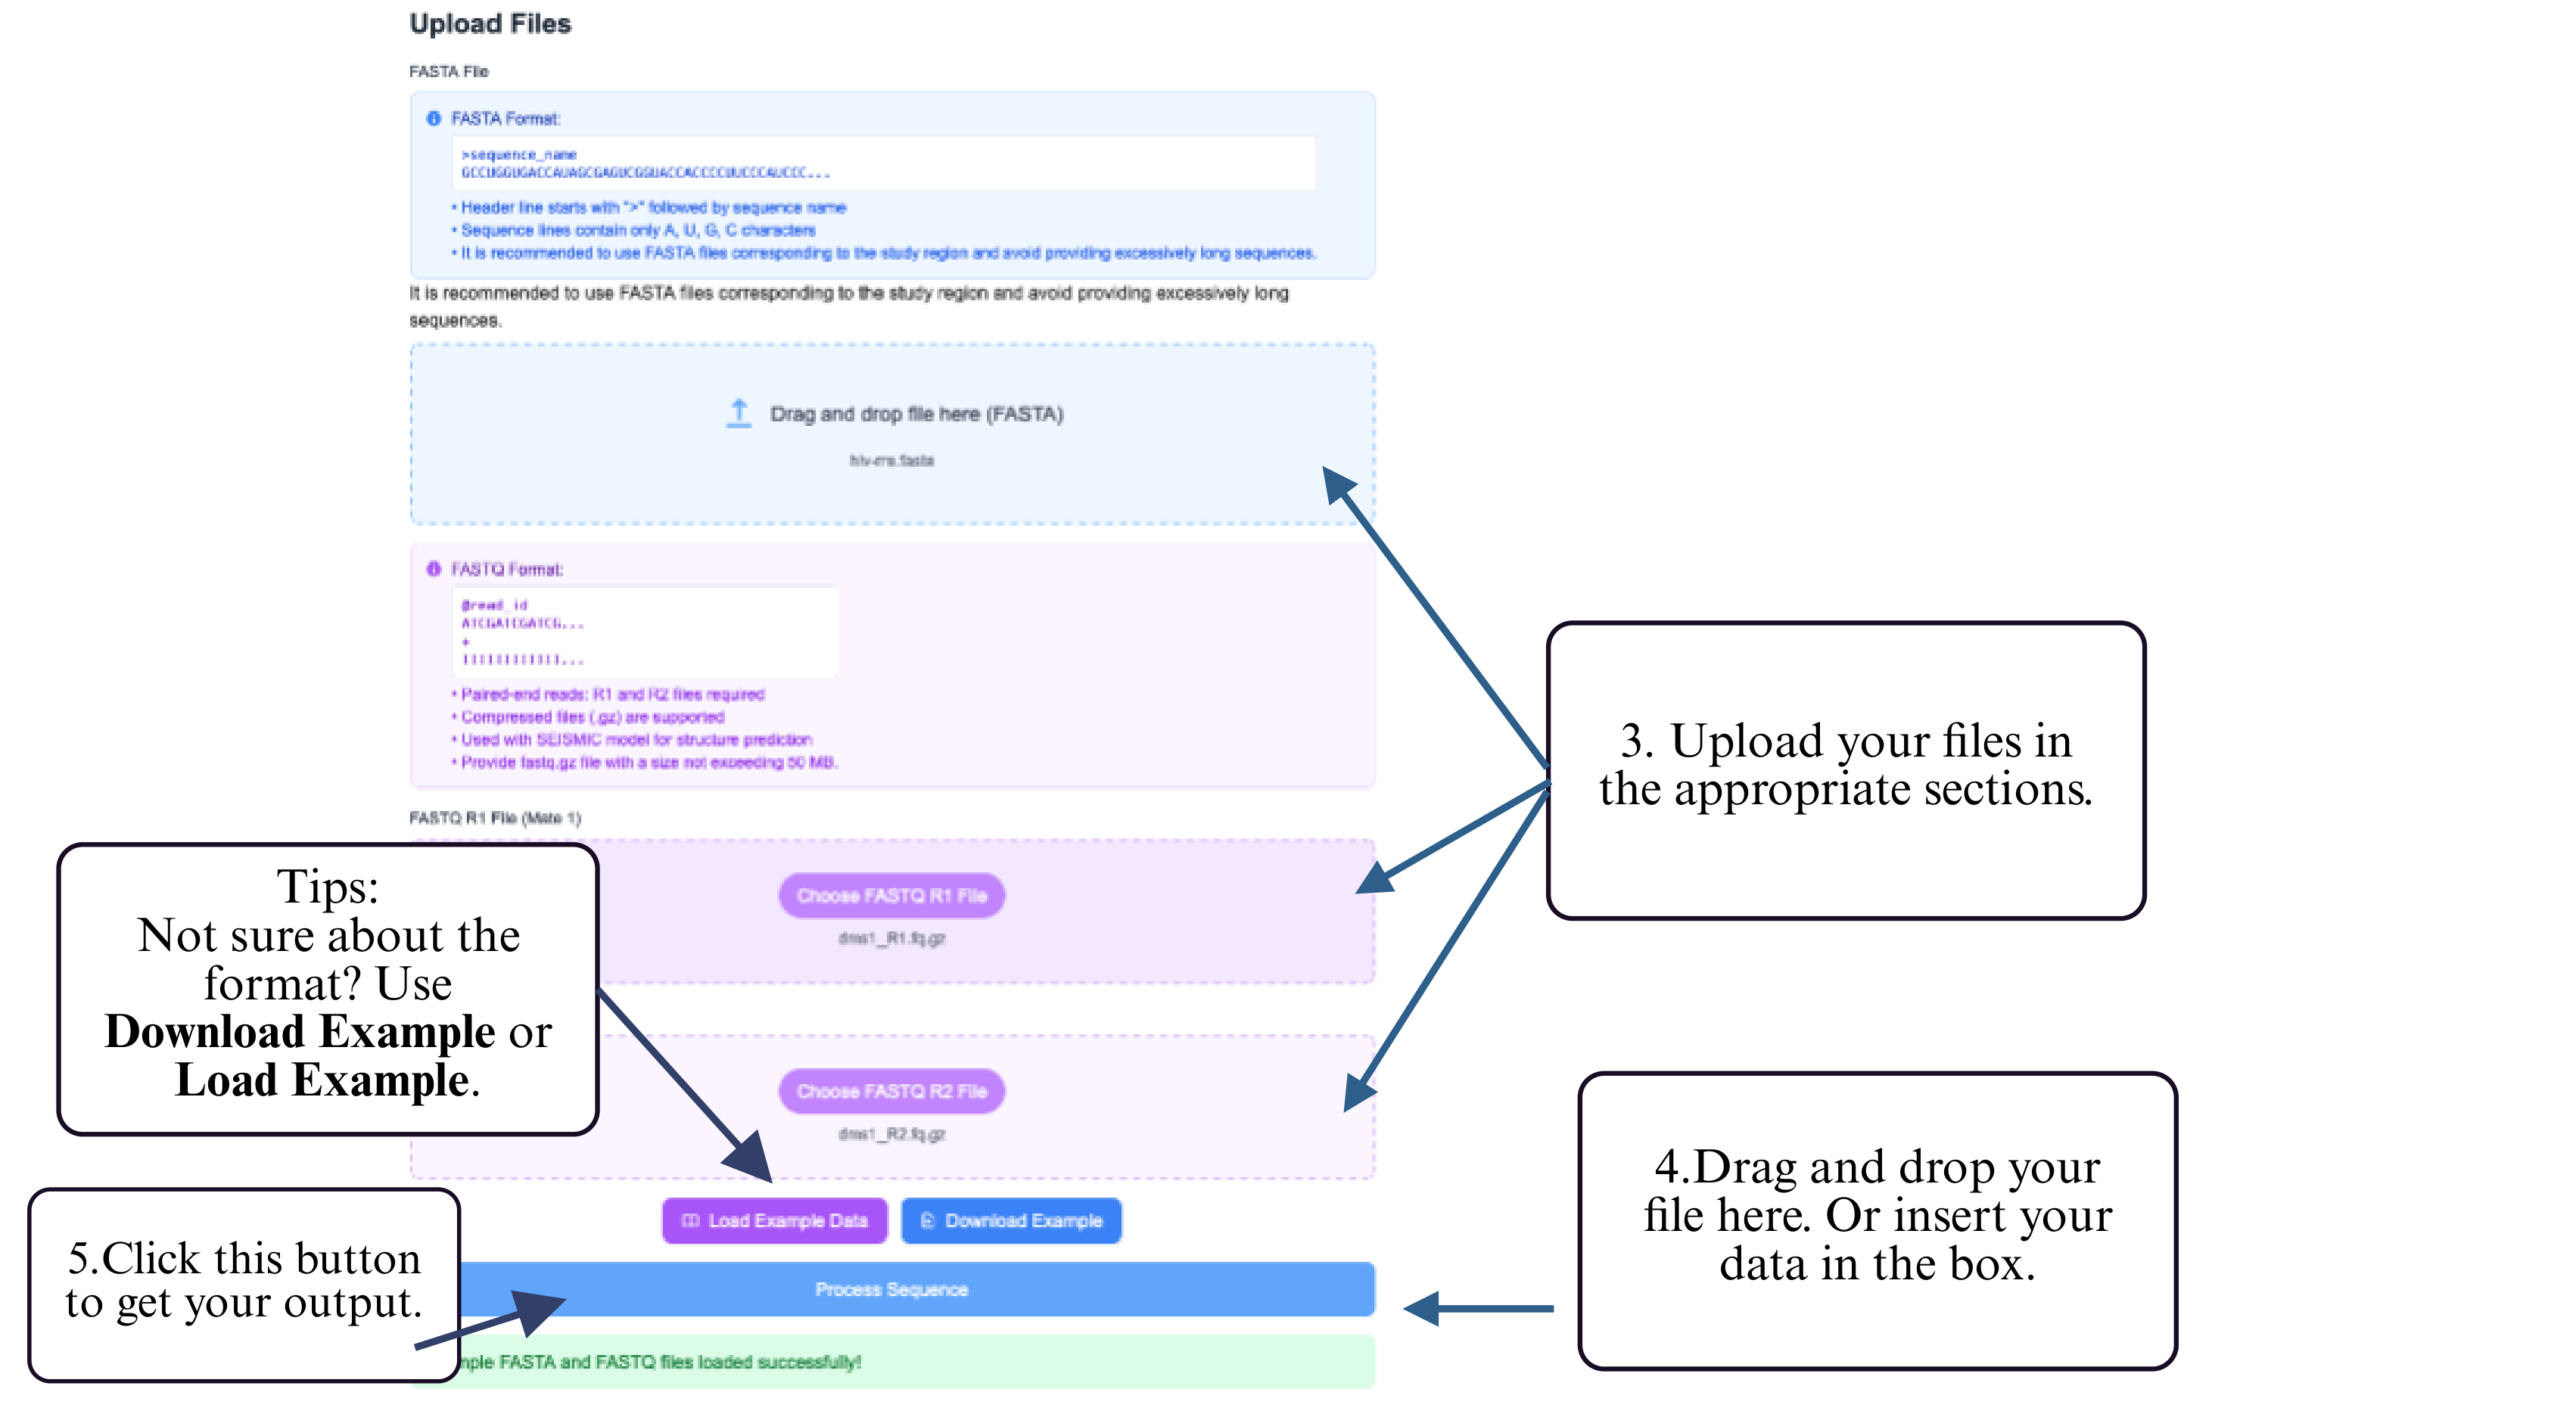
Step 5: Download representative structures and cluster summary upon completion.
Step 6: After processing, click the download button to retrieve your ensemble results.
(Optional) Use Clear Cache to clear previous results before starting a new analysis.
Step 7: You can also click Visualize Structure to open the interactive visualization tool and inspect your predicted RNA structure directly in the browser.
Step 8: On the visualization page, your sequence and structure will be automatically loaded into the input box. Click Generate Visualization to produce the interactive RNA structure display, where you can zoom, drag, and explore detailed folding patterns.
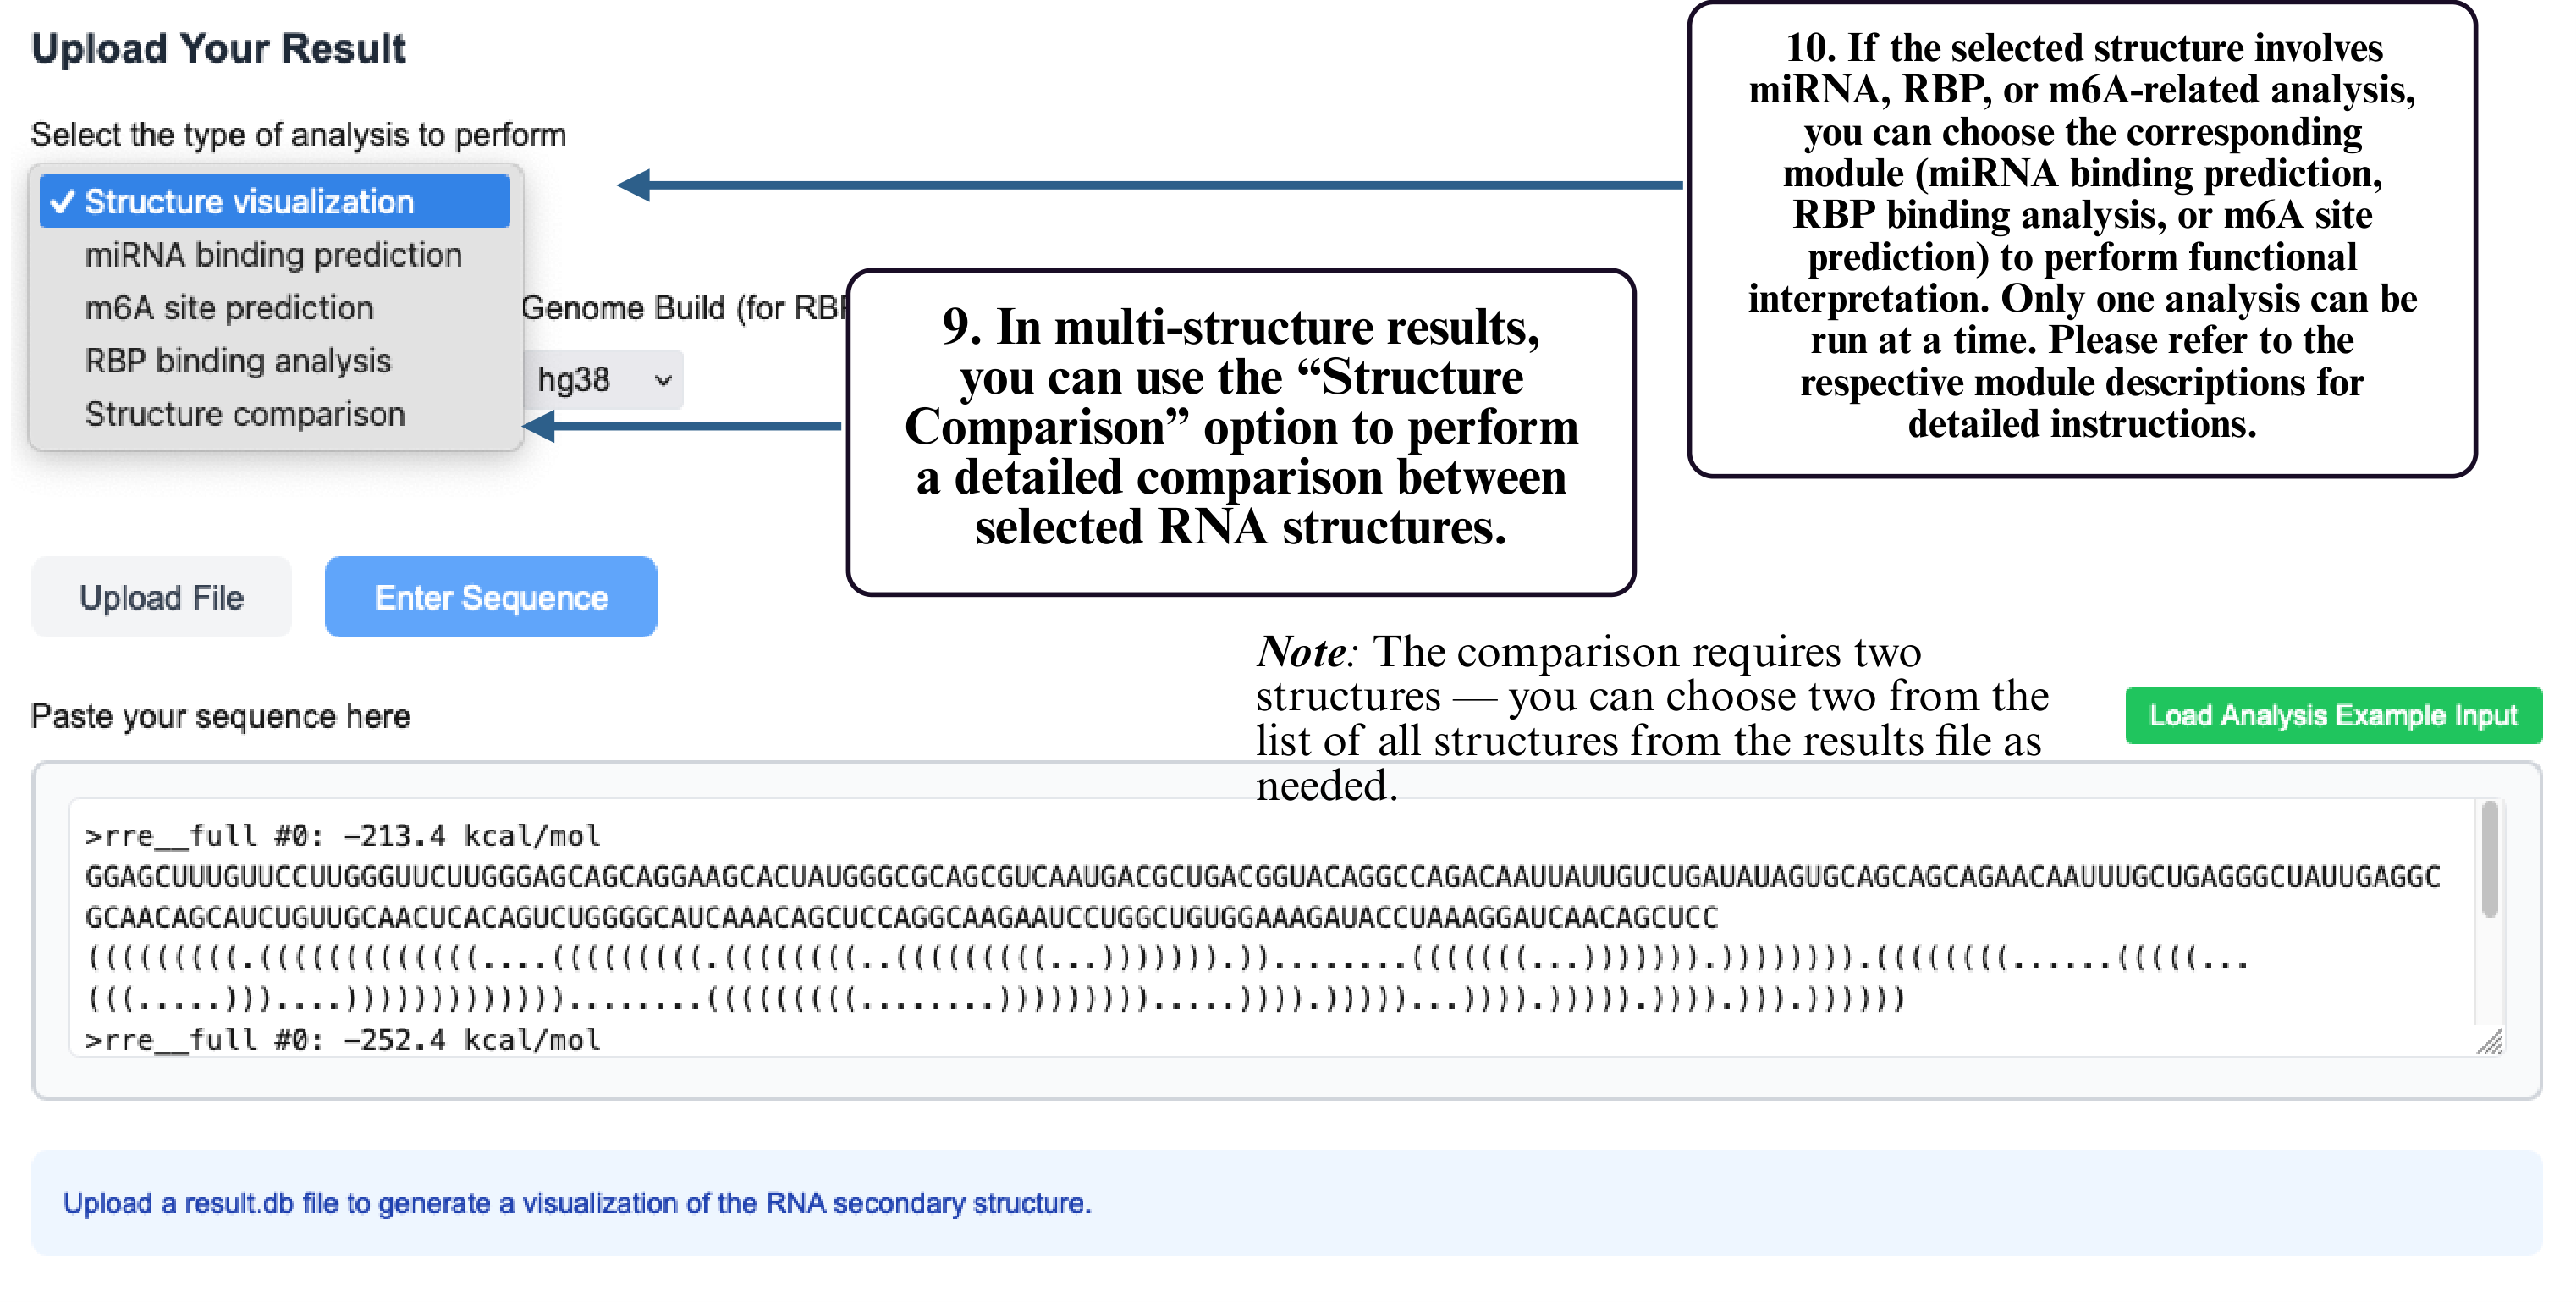
Step 9: In multi-structure results, select Structure Comparison to compare different RNA structural conformations.
Step 10: If your structure involves miRNA, RBP, or m6A analysis, select the corresponding module to run functional prediction. Only one module can be used at a time.
miRNA Binding Site Analysis
This analysis module identifies potential miRNA binding sites on RNA secondary structures. It takes structured RNA input (in Vienna dot-bracket format) and scans for target motifs based on sequence and accessibility features.
Step 1: Select the miRNA Binding Site Analysis option.
Step 2: Choose relevant parameters such as species or binding rules.
Step 3: Select your input method (e.g., upload file or manual entry).
Step 4: Paste your structured RNA (Vienna format) into the input box.
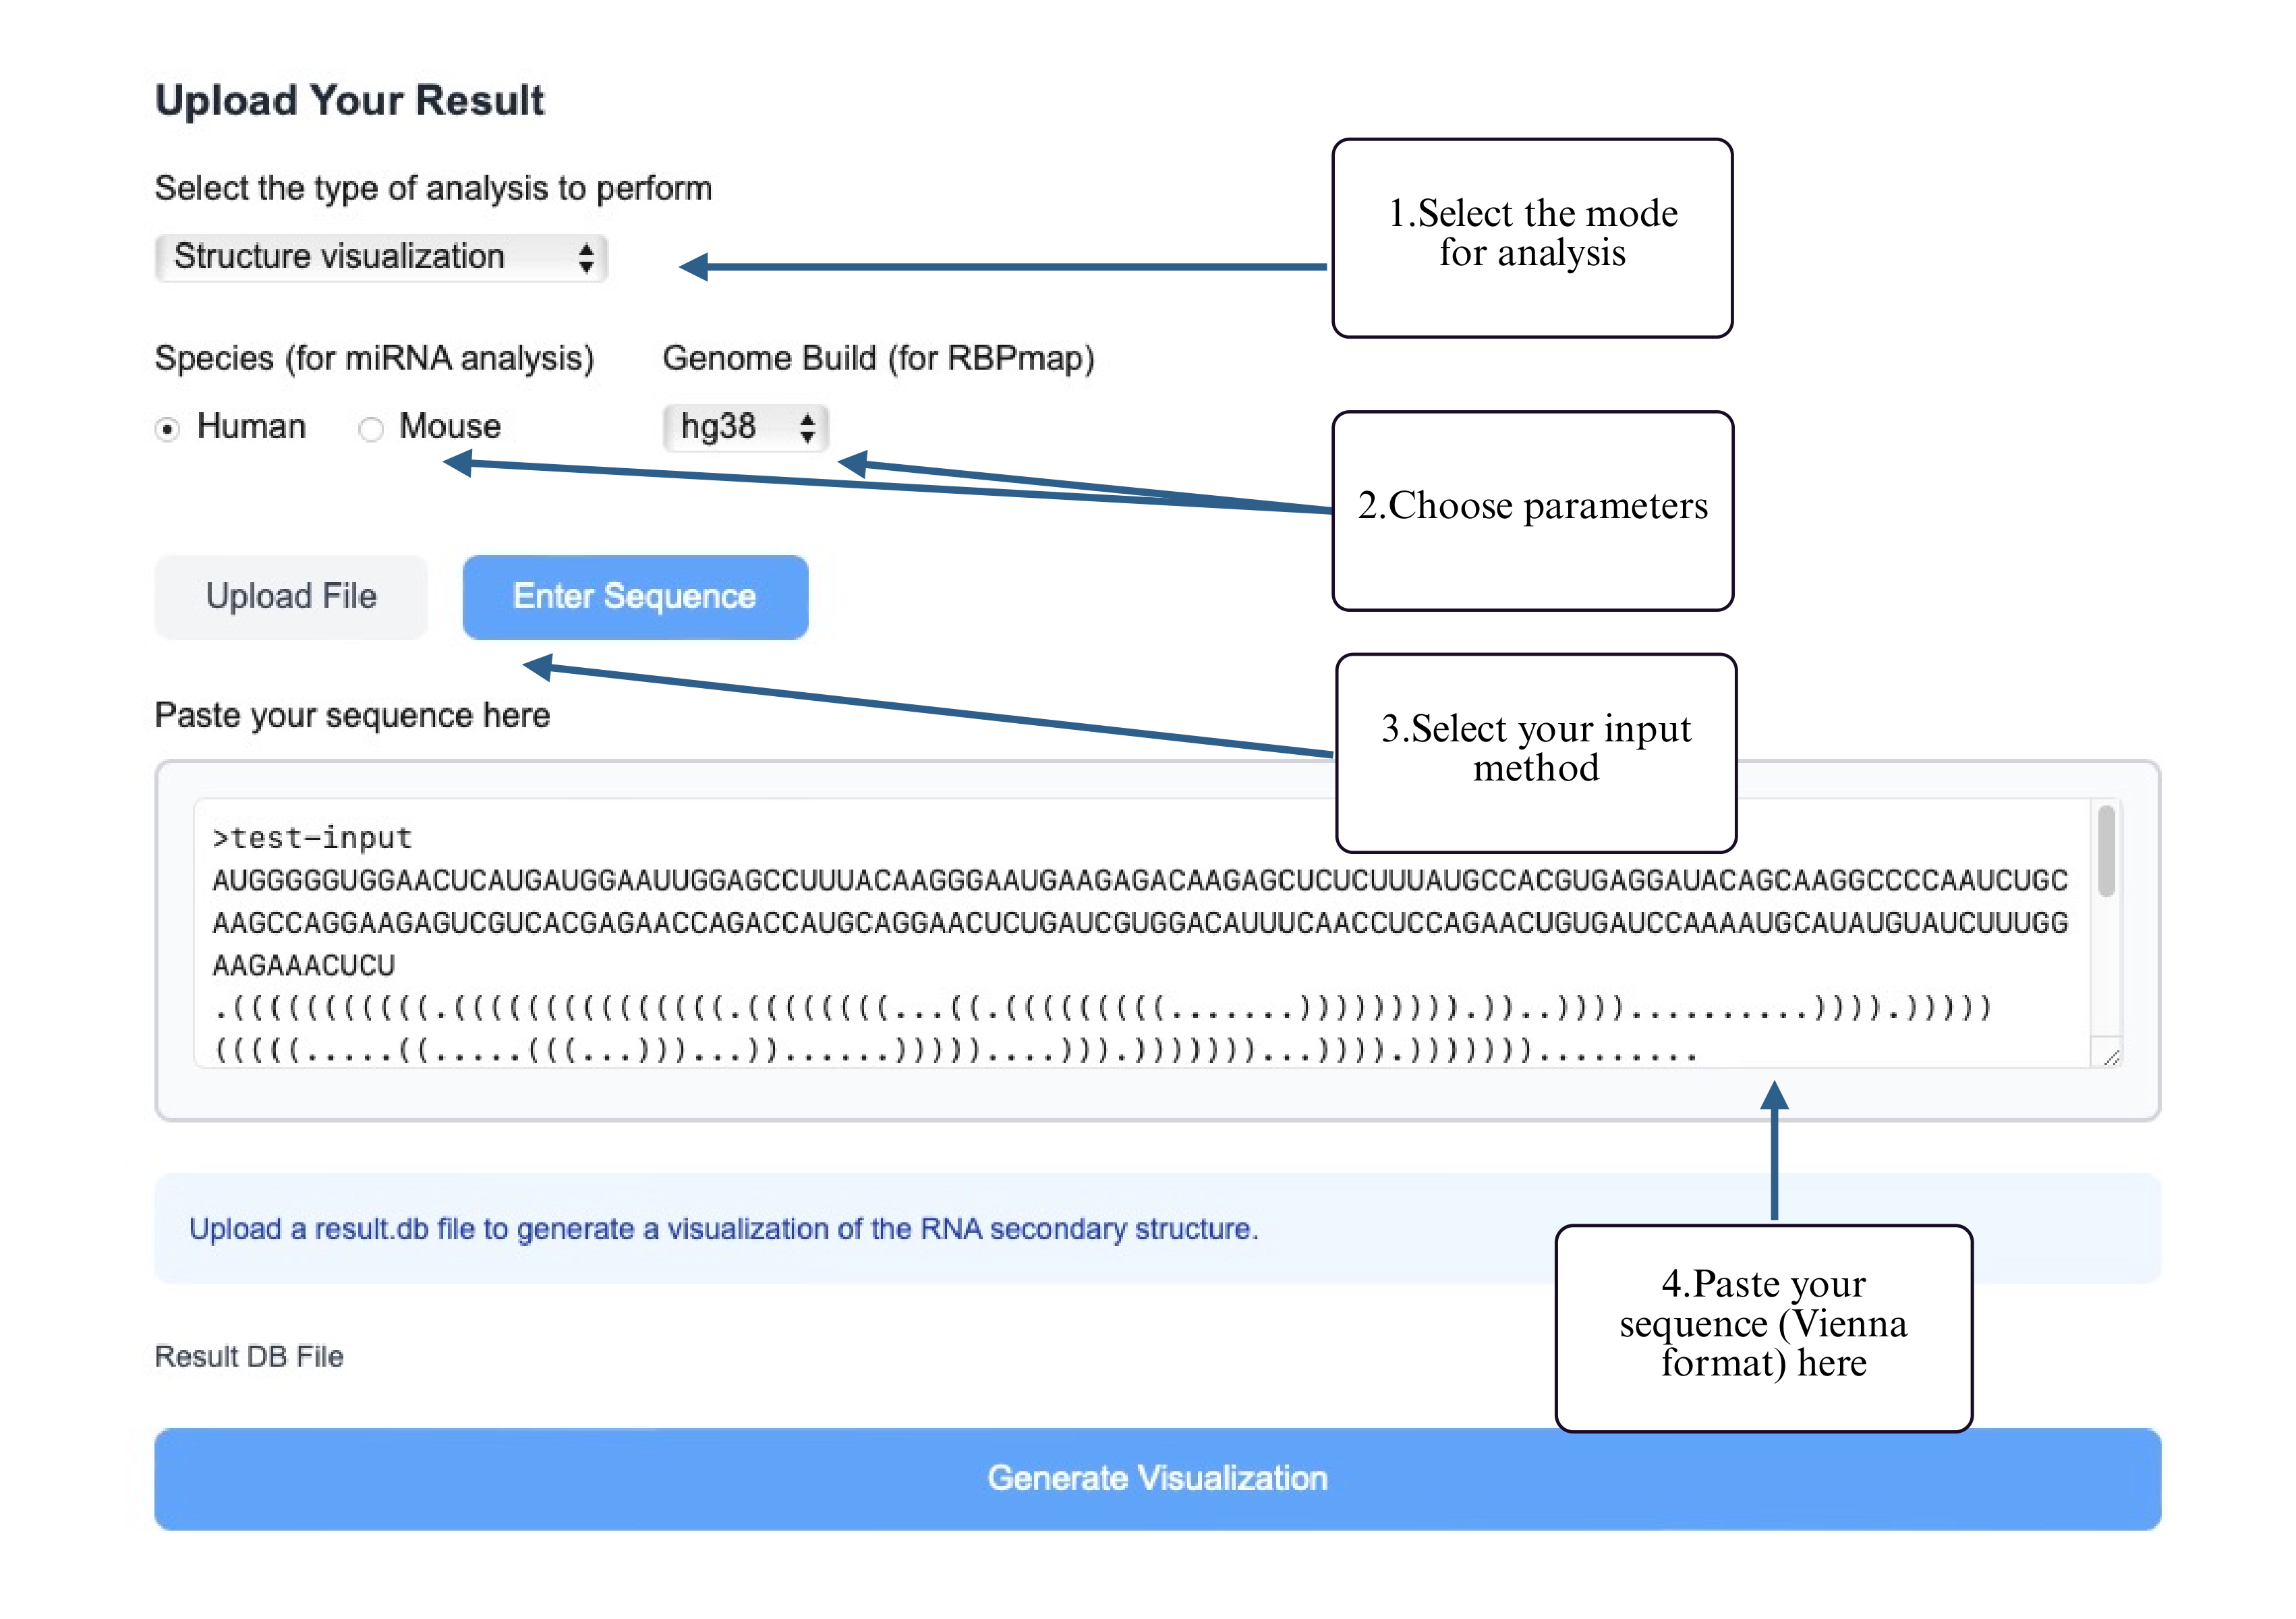
Step 5: Once the analysis is complete, download the predicted miRNA binding results.
The output of the miRNA Binding Site Analysis consists of a complete table listing all predicted miRNA binding sites on the left, including target sequences, binding positions, and interaction scores. On the right, a ranked summary highlights the top 3 miRNAs with the highest predicted binding confidence. Below, the corresponding binding regions of these top 3 miRNAs are visualized on the RNA secondary structure using an interactive SVG rendered by forna, with the binding sites clearly highlighted for intuitive structural interpretation.
RBP Binding Site Analysis
This module predicts RNA-binding protein (RBP) binding sites based on sequence motifs and RNA structural context.
Step 1: Select the RBP binding analysis mode in the Analysis section.
Step 2: Choose relevant parameters such as species and genome build.
Step 3: Select your input method (upload or manual input).
Step 4: Paste your structured RNA (Vienna format) into the input box.
Step 5: Download your result files use the buttons inside the dashed box.
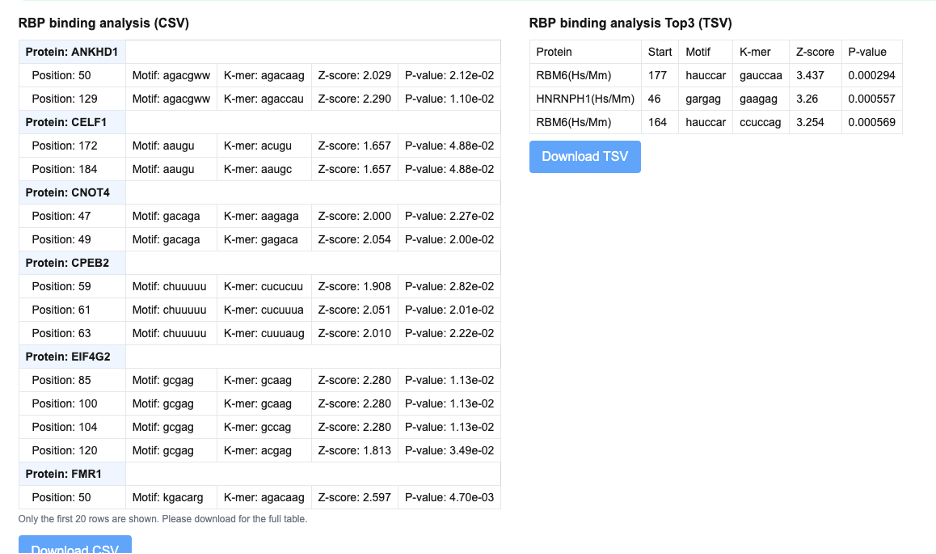
The output of the RBP Binding Site Analysis module includes a complete table on the upper-left, listing all predicted RBP binding sites along with their matched motifs, binding positions, Z-scores, and P-values. On the upper-right, a ranked summary shows the top 3 RBP binding events, sorted primarily by Z-score, and in cases of ties, prioritized by lower P-values. Below, the RNA secondary structure is visualized using forna, with the binding sites corresponding to the top 3 RBPs highlighted directly on the structure, enabling clear interpretation of their structural context.
m6A Site Prediction
This module identifies potential m6A methylation sites using sequence features and RNA structure.
Step 1: Select the m6A site prediction mode in the Analysis section.
Step 2: Set prediction parameters like species and confidence level.
Step 3: Select your input method.
Step 4: Paste your structured RNA (Vienna format) into the input box.
Step 5: Download your result files use the buttons inside the dashed box.
The output of the m6A Site Prediction module includes a comprehensive table in the upper-left showing all predicted m6A sites, including their positions, motif context, and confidence scores. On the upper-right, a ranked summary displays the top 5 m6A sites sorted by prediction score. In the next row, the left panel presents a secondary structure rendered with forna, where the top 5 predicted sites are highlighted in red on the RNA structure. The right panel shows a structure comparison view, visualizing changes between the original and modified RNA structures under m6A modification at those positions. At the bottom, the updated secondary structure of the RNA is shown with the top 5 sites assumed to be methylated, revealing potential structural shifts caused by m6A incorporation.
Structure Comparison
This tool compares two RNA secondary structures and highlights structural differences.
Step 1: Select the Structure Comparison mode in the Analysis section.
Step 2: Upload two RNA sequences with their dot-bracket structures.
Step 3: Submit to view aligned structures and differences.
Step 4: Download the comparison result if needed.
Step 5: Download your result files use the buttons inside the dashed box.
The output of the Structure Comparison module includes a helix-based visualization that highlights differences between two RNA secondary structures.
References
Fu, L., Cao, Y., Wu, J., Peng, Q., Nie, Q., & Xie, X. (2022). UFold: fast and accurate RNA secondary structure prediction with deep learning. Nucleic Acids Research, 50(3), e14-e14.
Sato, K., Akiyama, M., & Sakakibara, Y. (2021). RNA secondary structure prediction using deep learning with thermodynamic integration. Nature Communications, 12(1), 941.
Gong, T., Ju, F., & Bu, D. (2024). Accurate prediction of RNA secondary structure including pseudoknots through solving minimum-cost flow with learned potentials. Communications Biology, 7(1), 297.
Chen, C. C., & Chan, Y. M. (2023). REDfold: accurate RNA secondary structure prediction using residual encoder-decoder network. BMC Bioinformatics, 24(1), 122.
Lorenz, R., Bernhart, S. H., Höner zu Siederdissen, C., Tafer, H., Flamm, C., Stadler, P. F., & Hofacker, I. L. (2011). ViennaRNA Package 2.0. Algorithms for Molecular Biology, 6(1), 26.
Reuter, J. S., & Mathews, D. H. (2010). RNAstructure: software for RNA secondary structure prediction and analysis. BMC Bioinformatics, 11(1), 129.
Zhang, H., Li, S., Zhang, L., Mathews, D. H., & Huang, L. (2023). LazySampling and LinearSampling: fast stochastic sampling of RNA secondary structure with applications to SARS-CoV-2. Nucleic Acids Research, 51(2), e7-e7.
Allan, M., et al. (2024). Discovery and Quantification of Long-Range RNA Base Pairs in Coronavirus Genomes with SEARCH-MaP and SEISMIC-RNA. bioRxiv. https://doi.org/10.1101/2024.04.29.591762
Ding, Y., & Lawrence, C. E. (2003). A statistical sampling algorithm for RNA secondary structure prediction. Nucleic Acids Research, 31, 7280-7301.
Spasic, A., Assmann, S. M., Bevilacqua, P. C., & Mathews, D. H. (2018). Modeling RNA secondary structure folding ensembles using SHAPE mapping data. Nucleic Acids Research, 46(1), 314-323.
Morandi, E., Manfredonia, I., Simon, L. M., Anselmi, F., van Hemert, M. J., Oliviero, S., & Incarnato, D. (2021). Genome-scale deconvolution of RNA structure ensembles. Nature Methods, 18(3), 249-252.
Incarnato, D., Morandi, E., Simon, L. M., & Oliviero, S. (2018). RNA Framework: an all-in-one toolkit for the analysis of RNA structures and post-transcriptional modifications. Nucleic Acids Research, 46(16), e97-e97.
Incarnato, D., Neri, F., Anselmi, F., & Oliviero, S. (2016). RNA structure framework: automated transcriptome-wide reconstruction of RNA secondary structures from high-throughput structure probing data. Bioinformatics, 32(3), 459-461.
Saman Booy, M., Ilin, A., & Orponen, P. (2022). RNA secondary structure prediction with convolutional neural networks. BMC Bioinformatics, 23(1), 58.
Bugnon, L. A., Di Persia, L., Gerard, M., Raad, J., Prochetto, S., Fenoy, E., ... & Milone, D. (2023). sincFold: end-to-end learning of short- and long-range interactions for RNA folding. bioRxiv, 2023-10.